
Power Plot Visual by Akvelon
Creates visualizations from diverse chart types, combines multiple charts on one canvas, and adds custom annotations and tooltips.
AkvelonFreemium
Generates sourced data and visualizations while working in a document.
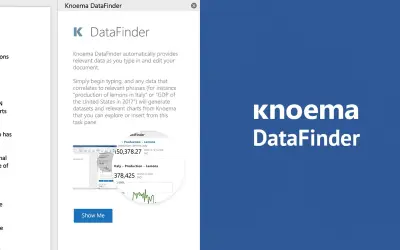
Knoema DataFinder generates facts, statistics, time series, datasets, and visualizations as text is entered. It displays these results with sources in a pane. Selected data or visualizations can be inserted into a document or project, and additional information can be explored. Highlighting a phrase produces related statistics and charts. The add-in is free to use, with additional services available by subscription.
Generates facts, statistics, time series, and datasets as text is entered.
Finds related statistics and charts for a highlighted phrase.
Adds selected data directly to a document.
Adds selected visualizations to a project.
Displays sources alongside generated data insights.
2,531 plugins in Analytics
Price distribution: 125 free, 147 freemium, 1,350 paid, 909 price not published
Creates visualizations from diverse chart types, combines multiple charts on one canvas, and adds custom annotations and tooltips.
Akvelon
Creates financial and business reports in Power BI with automatic variance calculations, P&L logic, and drill-down (s5, s6).
Zebra BI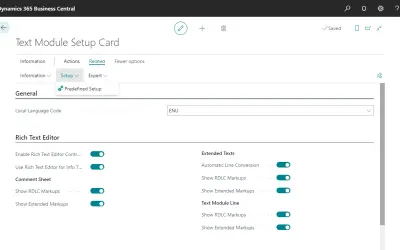
COSMO Text Module provides extended text management with a WYSIWYG editor for Microsoft Dynamics 365 Business Central.
COSMO CONSULT
Discover the why behind your data.
Data Courage«With Knoema DataFinder, you no longer need to search for the data you need online or in your company workspace — our AI engine, combined with the world’s largest database of available data — generates insights as you type. While you work, simply open the Knoema DataFinder pane to see the insights (facts, statistics …»