VLC PrintNode Integration
Print Microsoft Dynamics 365 Business Central reports to local or network printers from connected devices via PrintNode.
VLC Solutions LLCPaid
Exposes 73 Business Central tables as API endpoints for Power BI and other IT systems.
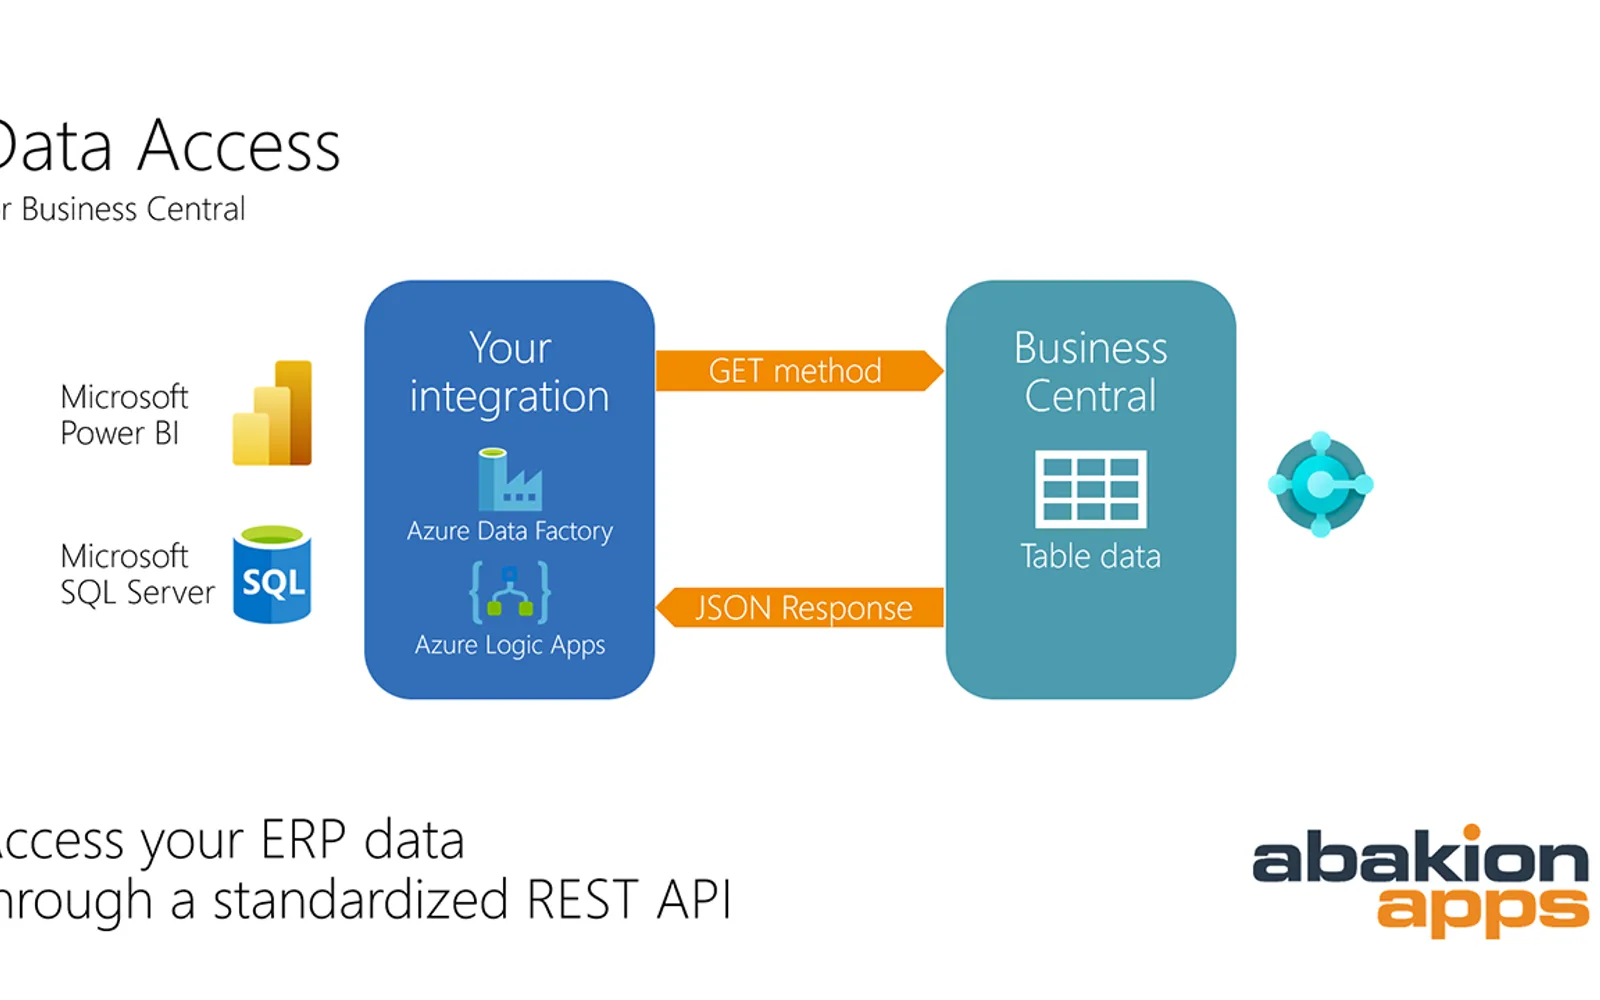
The app exposes 73 Business Central tables as API endpoints. GET requests return JSON responses for use with Power BI and other reporting, storage, or IT solutions. Integrations can track deletions and load recently modified data. The app is updated for new Business Central versions and does not include calculated data fields or flow fields.
Exposes 73 Business Central tables and their regular fields as API endpoints.
Returns Business Central data in JSON after a GET request.
Tracks deletions in relevant tables when configured.
Updates the API to reflect changes in the Business Central table structure.
Works with integration options such as Power BI OData connectors, Azure Logic Apps, Data Factory, and Azure functions.
Data Access - API data integration is a paid, cloud-deployed listing, as are VLC PrintNode Integration, Aimplan Data Input Table, and Statistical Accounts. It was updated on May 2026; VLC PrintNode Integration was updated in Nov 2025, Aimplan Data Input Table in Aug 2026, and Statistical Accounts in Jun 2025.
| Name | Pricing | Deployment | Updated |
|---|---|---|---|
| this plugin | Paid | Cloud | |
| VLC PrintNode Integration | Paid | Cloud | |
| Aimplan Data Input Table | Paid | Cloud | |
| Statistical Accounts | Paid | Cloud |
910 plugins in Power BI · Analytics
Price distribution: 80 free, 115 freemium, 672 paid, 43 price not published
Print Microsoft Dynamics 365 Business Central reports to local or network printers from connected devices via PrintNode.
VLC Solutions LLC
A Power BI visual that lets users edit and maintain data stored in the Aimplan Azure SaaS service or Azure SQL databases.
Aimplan AB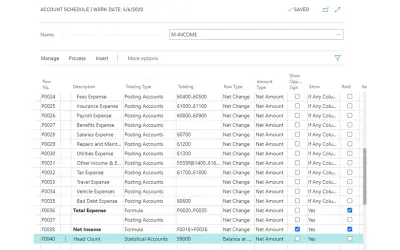
Tracks non-financial data such as headcount and square footage in G/L accounts for reporting in Dynamics 365 Business Central.
Stoneridge Software LLC
Gantt Chart is a project management visual for Microsoft Power BI that tracks schedules, milestones, and resource workloads.
ChartPad«The Data Access app exposes 73 tables from Microsoft Dynamics 365 Business Central as API endpoints. You can use this to connect Microsoft Power BI to your Business Central - or to enrich any other IT solution with your ERP-data. The app complies with all Microsoft standards – and it’s updated with each and every new …»