
Power Plot Visual by Akvelon
Creates visualizations from diverse chart types, combines multiple charts on one canvas, and adds custom annotations and tooltips.
AkvelonFreemium
Create customizable scatter plots that compare products across X and Y dimensions.
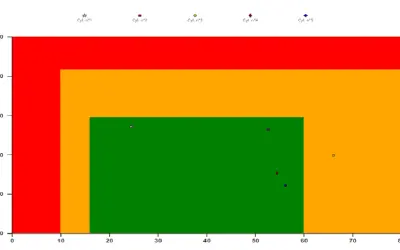
Visualizes business data in a scatter plot using X and Y dimensions, with business rules added through drag and drop. Displays customizable good, medium, and bad zones whose position and size can vary by product.
Visualizes business data using an X dimension and a Y dimension.
Allows business rules to be added through drag and drop.
Provides customizable good, medium, and bad zones.
Allows each product to have different zone positions and sizes.
2,531 plugins in Analytics
Price distribution: 125 free, 147 freemium, 1,350 paid, 909 price not published
Creates visualizations from diverse chart types, combines multiple charts on one canvas, and adds custom annotations and tooltips.
Akvelon
Creates financial and business reports in Power BI with automatic variance calculations, P&L logic, and drill-down (s5, s6).
Zebra BI
COSMO Text Module provides extended text management with a WYSIWYG editor for Microsoft Dynamics 365 Business Central.
COSMO CONSULT
Discover the why behind your data.
Data Courage«This visual enables you to visualize your business data into an intelligent scatter plot, based on a X dimension as well as an Y dimension. Design your business rules and implement them into the visual through a simple drag and drop, in order to analyze the performance of your products. Have a better understanding of …»