
Graphs for Confluence
Display Mermaid-described graphs on Confluence pages using a macro.
BertlyFree
Create line, bar, and pie charts from CSV data in Confluence pages.
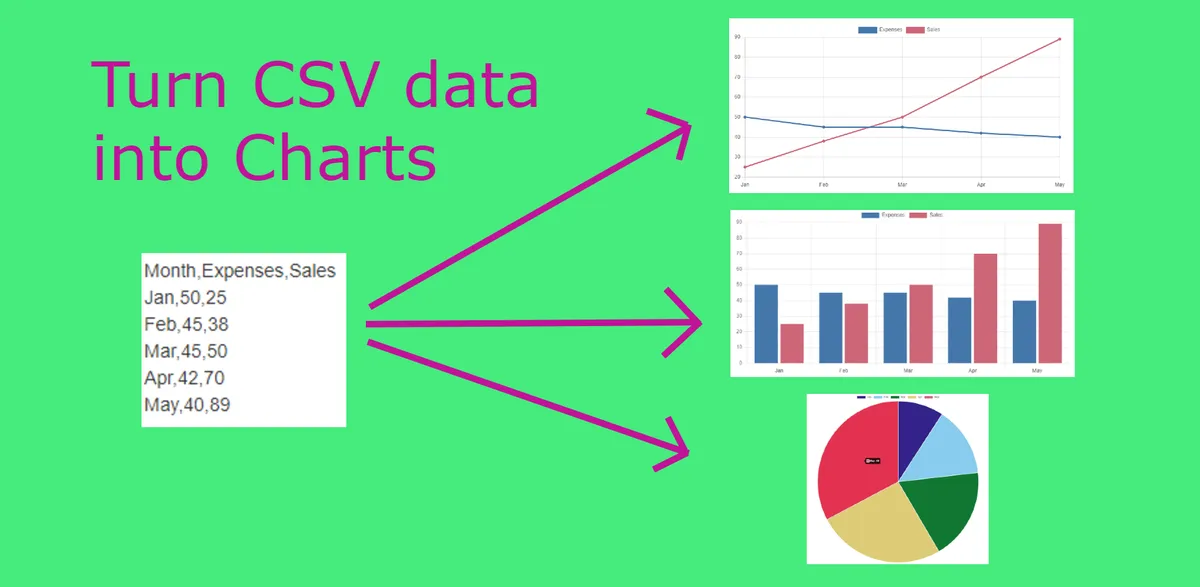
CSV to Chart for Confluence displays charts and graphs in Confluence pages using CSV data. CSV data can come from Confluence attachments, external URLs, or pasted input. The add-in supports line, bar, and pie charts, with row and column selection for the displayed data.
Creates line, bar, and pie charts from CSV data.
Accepts CSV data from Confluence attachments, URLs, or pasted input.
Selects which rows or columns from the CSV data appear in the charts.
CSV to Chart for Confluence is paid and cloud-deployed, while Graphs for Confluence is free and also cloud-deployed. CSV to Chart for Confluence was updated in Sep 2022, compared with Jan 2026 for Graphs for Confluence.
| Name | Pricing | Deployment | Updated |
|---|---|---|---|
| this plugin | Paid | Cloud | |
| Graphs for Confluence | Free | Cloud |
990 plugins in Confluence · Data and analytics
Price distribution: 228 free, 378 freemium, 384 paid
Display Mermaid-described graphs on Confluence pages using a macro.
Bertly
Adds a searchable Q&A forum to Confluence with voting, tags, permissions, and notifications.
Firnity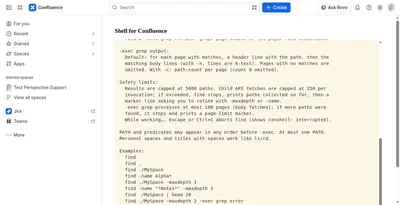
Manage Confluence pages through a command-line-style console for navigation, search, viewing, copying, and moving.
Kenputer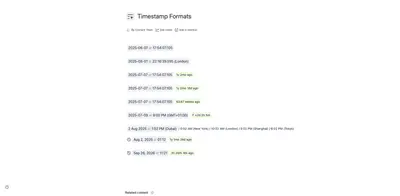
Adds natural-language timestamps, timezone conversions, countdowns, and ISO copying to Confluence pages.
Crenwiz«Easily turn CSV data into Line, Bar and Pie Charts and Graphs. Get the CSV data from attachments, external URLs or just paste the data in. Choose exactly which rows or columns of the data to display. Made by Grovr . Grovr have been producing apps and plugins for Atlassian Confluence and JIRA since 2017. Grovr plugins …»