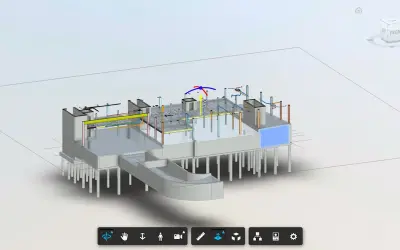
Autodesk® Data Connector for Power BI - Viewer
Fetches data from Data Exchanges and feeds them into Microsoft Power BI to construct comprehensive reports and dashboards.
Autodesk, Inc.Paid
Connects industrial data to Power BI for data management, visualization, and AI-based analytics.
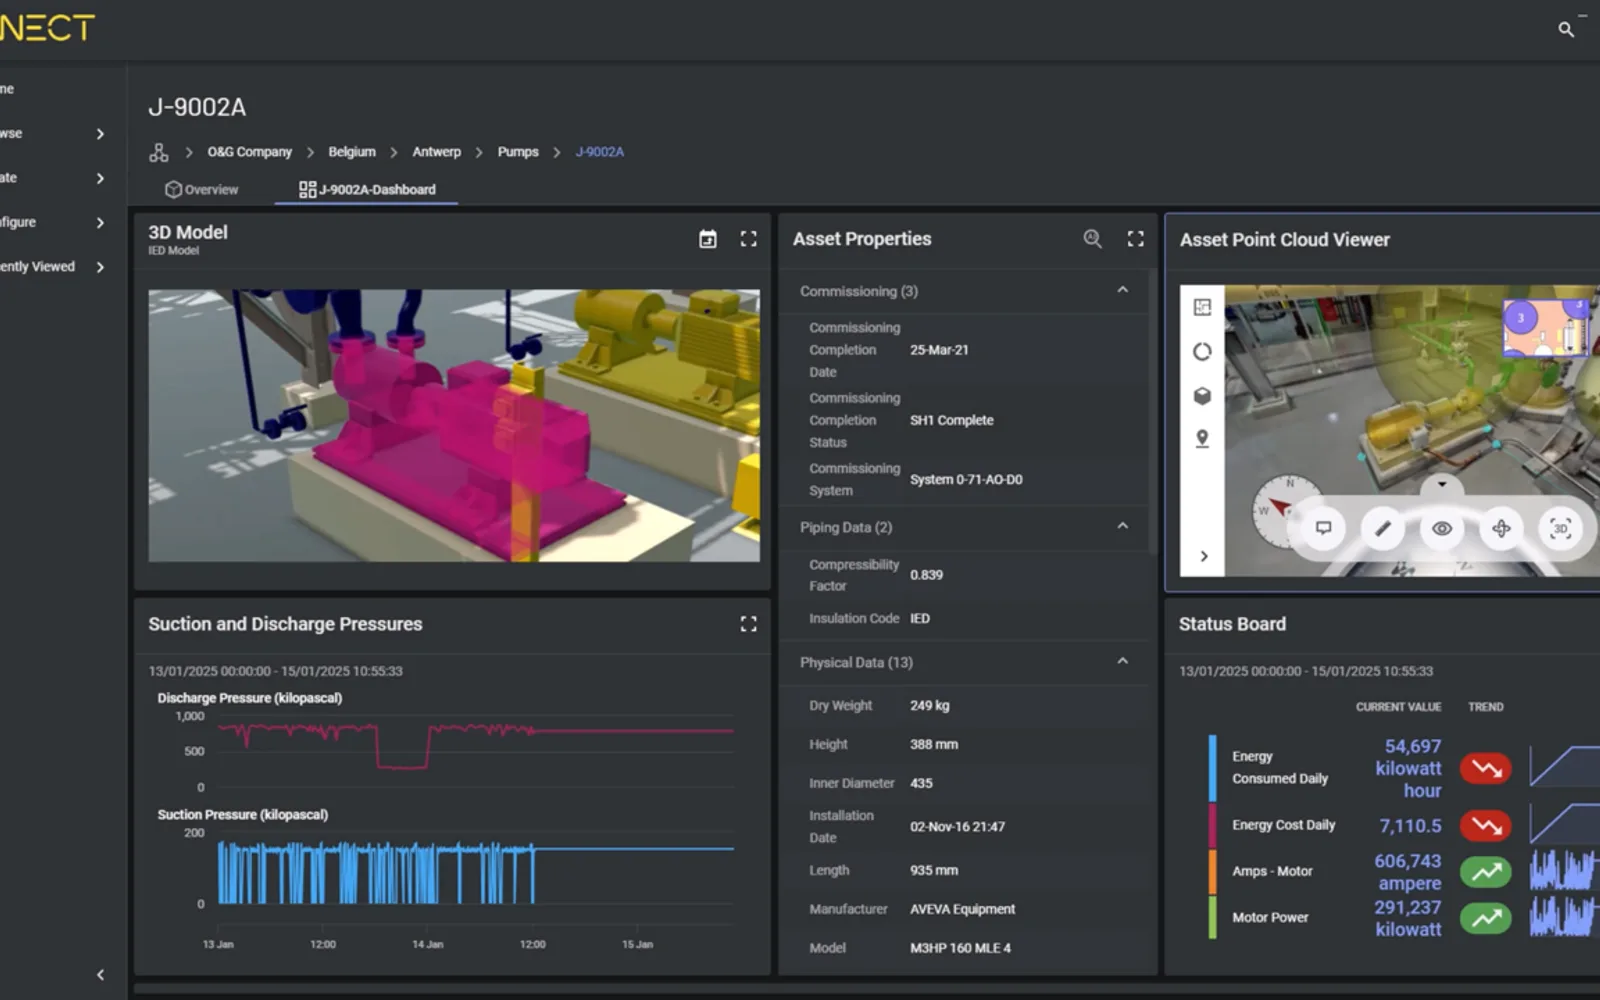
Aggregates, stores, curates, and shares industrial information from multiple sources and sites. CONNECT supports customizable data views, visualizations, AI-driven models, analytics, and integrated data sources. It also provides a Power BI connector, REST APIs, Databricks connectivity, and a generative AI chat tool for surfacing industrial information.
Aggregates information from multiple and remote sources and stores time series and event data.
Supports customized views of industrial information and connected communities for data sharing.
Creates customizable visualizations from CONNECT and integrated data sources.
Uses cloud-based AI and machine learning to predict process outcomes and asset behavior.
Provides a Microsoft Power BI connector and REST APIs.
Connects industrial data to Databricks.
Includes an industrial AI assistant that surfaces industrial information through chat.
CONNECT is free, while Autodesk® Data Connector for Power BI - Viewer is paid. Both listings use cloud deployment. CONNECT was updated on Aug 2026, while Autodesk® Data Connector for Power BI - Viewer was updated in Jul 2026.
| Name | Pricing | Deployment | Updated |
|---|---|---|---|
| this plugin | Free | Cloud | |
| Autodesk® Data Connector for Power BI - Viewer | Paid | Cloud |
657 plugins in Power BI · Analytics
Price distribution: 73 free, 108 freemium, 441 paid, 35 price not published
Fetches data from Data Exchanges and feeds them into Microsoft Power BI to construct comprehensive reports and dashboards.
Autodesk, Inc.
Gantt Chart is a project management visual for Microsoft Power BI that tracks schedules, milestones, and resource workloads.
ChartPad
Creates visualizations from diverse chart types, combines multiple charts on one canvas, and adds custom annotations and tooltips.
Akvelon
Creates financial and business reports in Power BI with automatic variance calculations, P&L logic, and drill-down (s5, s6).
Zebra BI«Access, visualize, and model your industrial information to predict and inform more efficient outcomes. Created specifically for industry, CONNECT allows you to aggregate, curate, and share information securely and easily across multiple sites and data types in a collaborative and frictionless environment. CONNECT …»