
Power Plot Visual by Akvelon
Creates visualizations from diverse chart types, combines multiple charts on one canvas, and adds custom annotations and tooltips.
AkvelonFreemium
Tracks Azure costs, usage, performance, virtual machine utilization, and migration workloads.
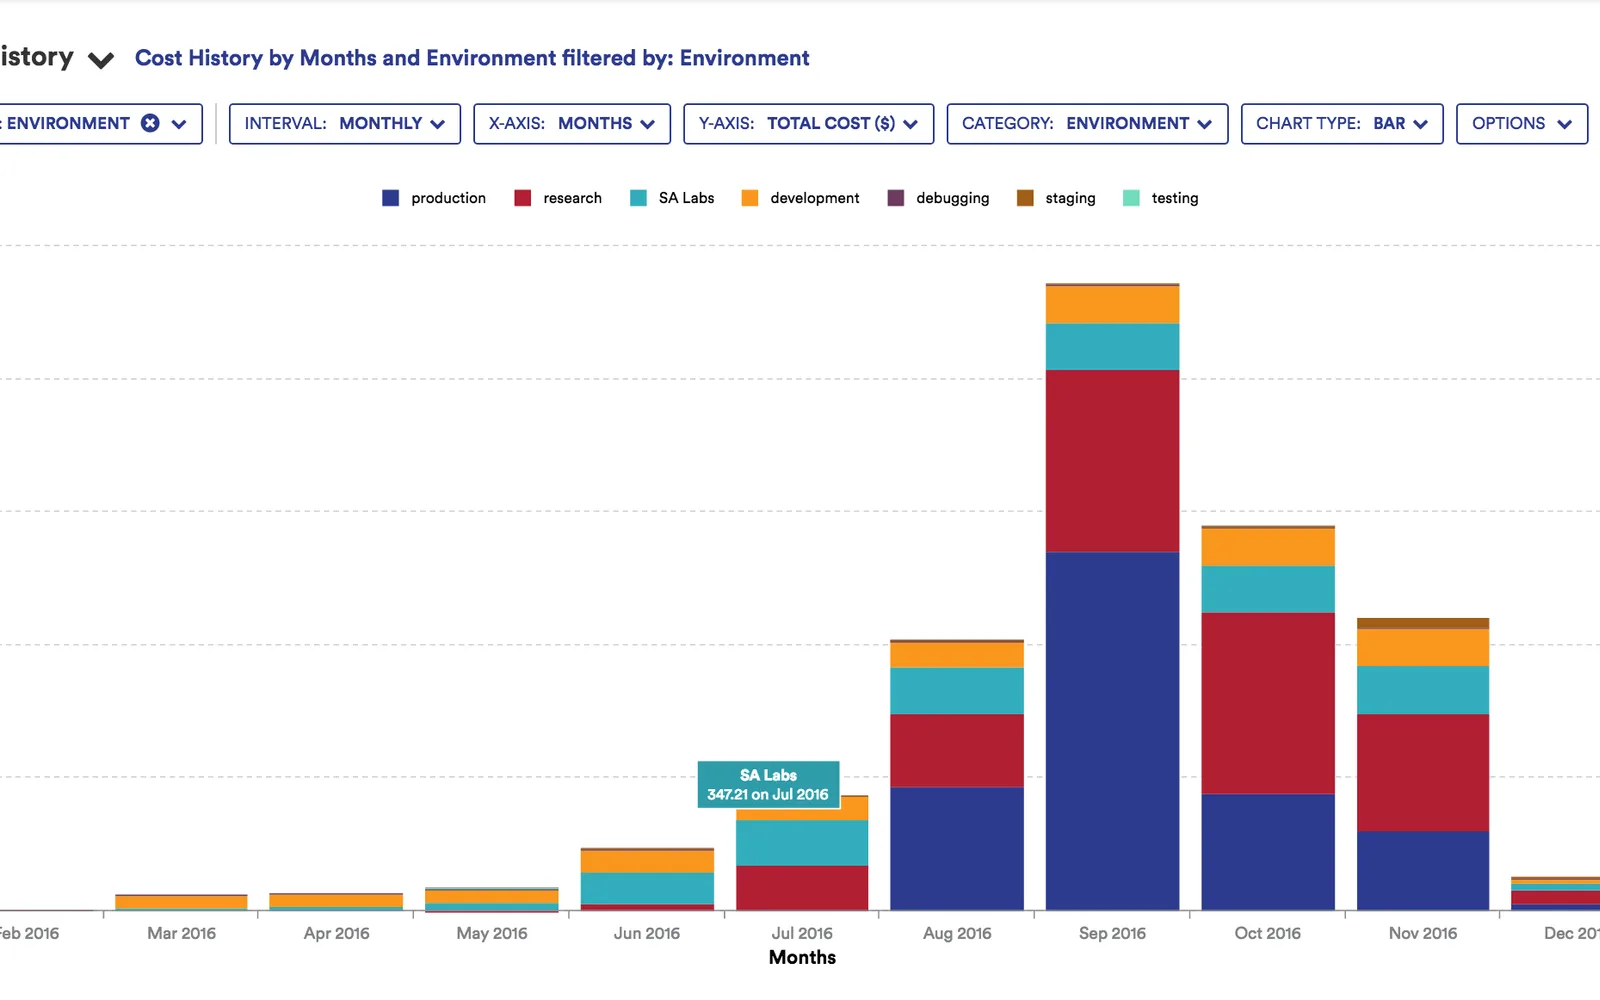
CloudHealth tracks Azure cost, usage, and performance across subscriptions, enrollments, and business groups. It reports spend under a Microsoft Enterprise Agreement and by department or project. Policies can send notifications about burn-down rates and underutilized infrastructure. Rightsizing reports examine virtual machine CPU, memory, network, and disk use, while Migration Assessment models workloads for migration to Azure.
Tracks Azure cost, usage, and performance by subscription, enrollment, or business grouping.
Reports Azure spend under a Microsoft Enterprise Agreement and by department or project.
Uses perspectives, tags, and policies to organize and visualize assets by business grouping.
Reports on virtual machine CPU, memory, network, and disk use to identify underutilized VMs.
Assesses and models workloads for migration to Azure.
2,531 plugins in Analytics
Price distribution: 125 free, 147 freemium, 1,350 paid, 909 price not published
Creates visualizations from diverse chart types, combines multiple charts on one canvas, and adds custom annotations and tooltips.
Akvelon
Creates financial and business reports in Power BI with automatic variance calculations, P&L logic, and drill-down (s5, s6).
Zebra BI
COSMO Text Module provides extended text management with a WYSIWYG editor for Microsoft Dynamics 365 Business Central.
COSMO CONSULT
Discover the why behind your data.
Data Courage«Using CloudHealth with Azure gives you consistent visibility and tracking for cost/usage/performance. Easily track by subscription, enrollment, or any business grouping. • Burn-down reports: With CloudHealth, you can keep track of Azure spend based on your Microsoft Enterprise Agreement. Set policies to notify you …»