
Power Plot Visual by Akvelon
Creates visualizations from diverse chart types, combines multiple charts on one canvas, and adds custom annotations and tooltips.
AkvelonFreemium
Displays and filters date-based data through calendar views in a visual analytics product.
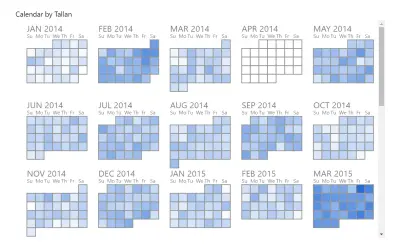
Presents aggregated information associated with dates in a calendar-style view. Separate annual and monthly modes allow navigation across different date ranges. The visual also supports formatting controls, keyboard-based range selection, and a drill-down feature marked as preview.
Organizes aggregated date-related information in a calendar-style display.
Shows date-related data in a year-level view.
Shows date-related data in a month-level view.
Allows date ranges to be selected with Control and Shift keyboard commands.
Provides standard options for formatting the visual.
Includes drill-down functionality identified as a preview feature.
2,531 plugins in Analytics
Price distribution: 125 free, 147 freemium, 1,350 paid, 909 price not published
Creates visualizations from diverse chart types, combines multiple charts on one canvas, and adds custom annotations and tooltips.
Akvelon
Creates financial and business reports in Power BI with automatic variance calculations, P&L logic, and drill-down (s5, s6).
Zebra BI
COSMO Text Module provides extended text management with a WYSIWYG editor for Microsoft Dynamics 365 Business Central.
COSMO CONSULT
Discover the why behind your data.
Data Courage«Tallan's Calendar Visual offers an exciting way to display and filter date related data. View the aggregation of data across a range of dates in a standard calendar layout. The visualization offers separate views for year and month, allowing users to zoom in on date ranges while presenting them clearly and effectively.»