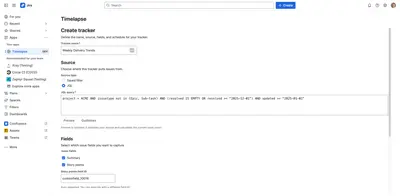
Timelapse for Jira
Tracks Jira filters and JQL over time with snapshots, comparisons, charts, and CSV exports.
Trophy AppsFree
Charts Jira epic or filter progress against elapsed time using buffer status indicators.
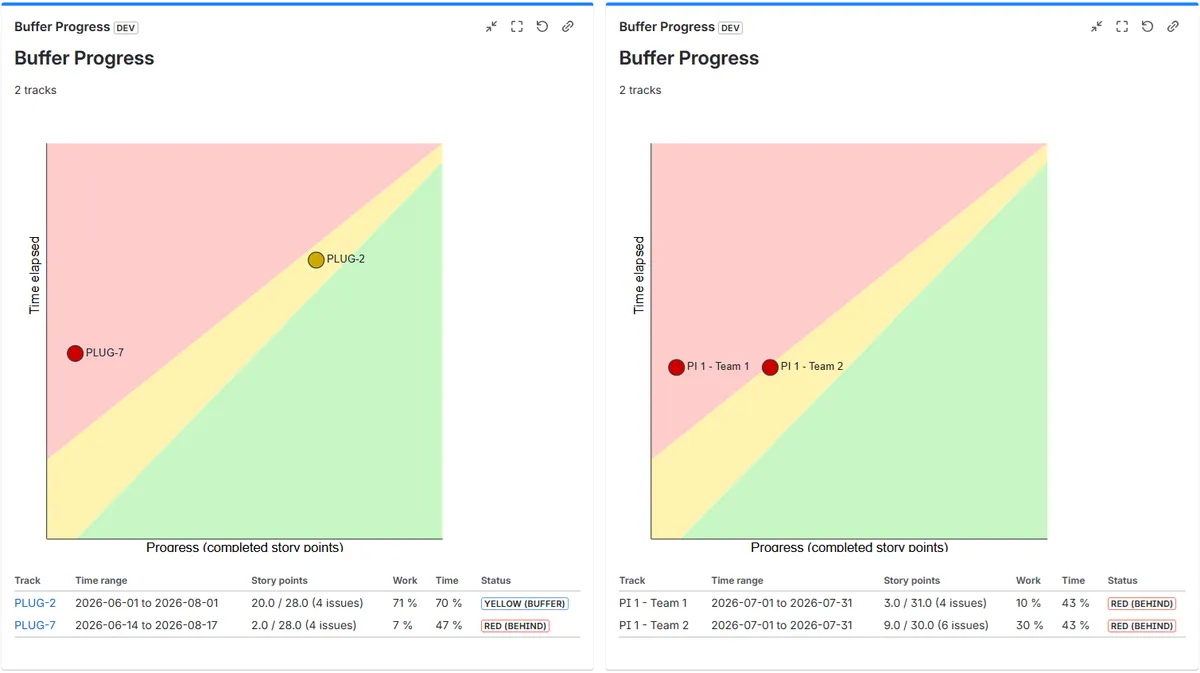
Buffer Progress adds buffer and fever charts to Jira dashboards. A chart can include up to 8 epics or saved filters and compare completed story points with elapsed time. Users can select story-point, start, and due-date fields, including custom fields, and assign date ranges to individual filter tracks. A summary table shows progress percentages and color-coded status. The app has read-only Jira access and does not send data outside the app.
Adds buffer and fever chart views to Jira dashboards.
Tracks up to 8 epics or saved filters within one chart.
Compares completed story points with time that has passed.
Supports configured story-point, start-date, and due-date fields, including custom fields.
Allows separate date ranges for filter-based tracks.
Shows progress percentages with green, yellow, and red status indicators.
Teams tracking delivery through Jira dashboards.
Buffer Progress is paid and cloud-deployed, with an update date of Sep 2026. Timelapse for Jira and Dashboard Insights for Jira are free and cloud-deployed, and each has an update date of Sep 2026. Veloscope - Epic Delivery Forecast is freemium, cloud-deployed, and has an update date of Aug 2026. Burnup Burndown charts: forecasting in Jira Dashboard gadget is freemium and cloud-deployed. Burnup Burndown chart gadget (forecast on Jira DC Dashboard) is paid and data-center deployed, with an update date of Sep 2026.
| Name | Pricing | Deployment | Updated |
|---|---|---|---|
| this plugin | Paid | Cloud | |
| Timelapse for Jira | Free | Cloud | |
| Dashboard Insights for Jira | Free | Cloud | |
| Veloscope - Epic Delivery Forecast | Freemium | Cloud | |
| Burnup Burndown charts: forecasting in Jira Dashboard gadget | Freemium | Cloud | |
| Burnup Burndown chart gadget (forecast on Jira DC Dashboard) | Paid | Data Center |
630 plugins in Jira · Data and analytics
Price distribution: 189 free, 230 freemium, 211 paid
Tracks Jira filters and JQL over time with snapshots, comparisons, charts, and CSV exports.
Trophy Apps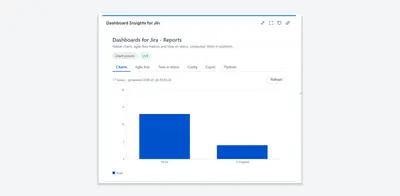
Create Jira dashboard charts, Agile reports, and time-in-status metrics from saved JQL queries.
Ivars Apps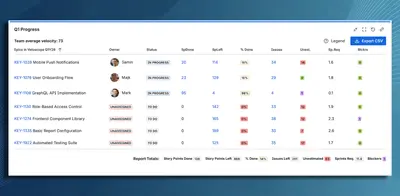
Forecasts epic delivery timing in Jira from remaining story points and sprint velocity.
Veloscope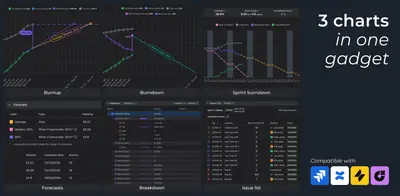
Forecasts and visualizes Agile scope and delivery progress in Jira dashboard gadgets.
Broken Build«Buffer Progress brings a clear buffer/fever-chart view to Jira dashboards. Track up to 8 epics or saved filters in one chart, compare work completed (story points) vs. time elapsed, and spot risk early with clear green/yellow/red status signals. Configure your own story point, start, and due date fields (including …»