Turbo360 - FinOps and Cost Management for Azure
Provides Azure cost visibility, anomaly detection, and optimization recommendations to help organizations reduce spending.
Kovai LtdFreemium
Tracks Azure DevOps projects, tasks, delivery timing, completion, and assignments through Power BI reports.
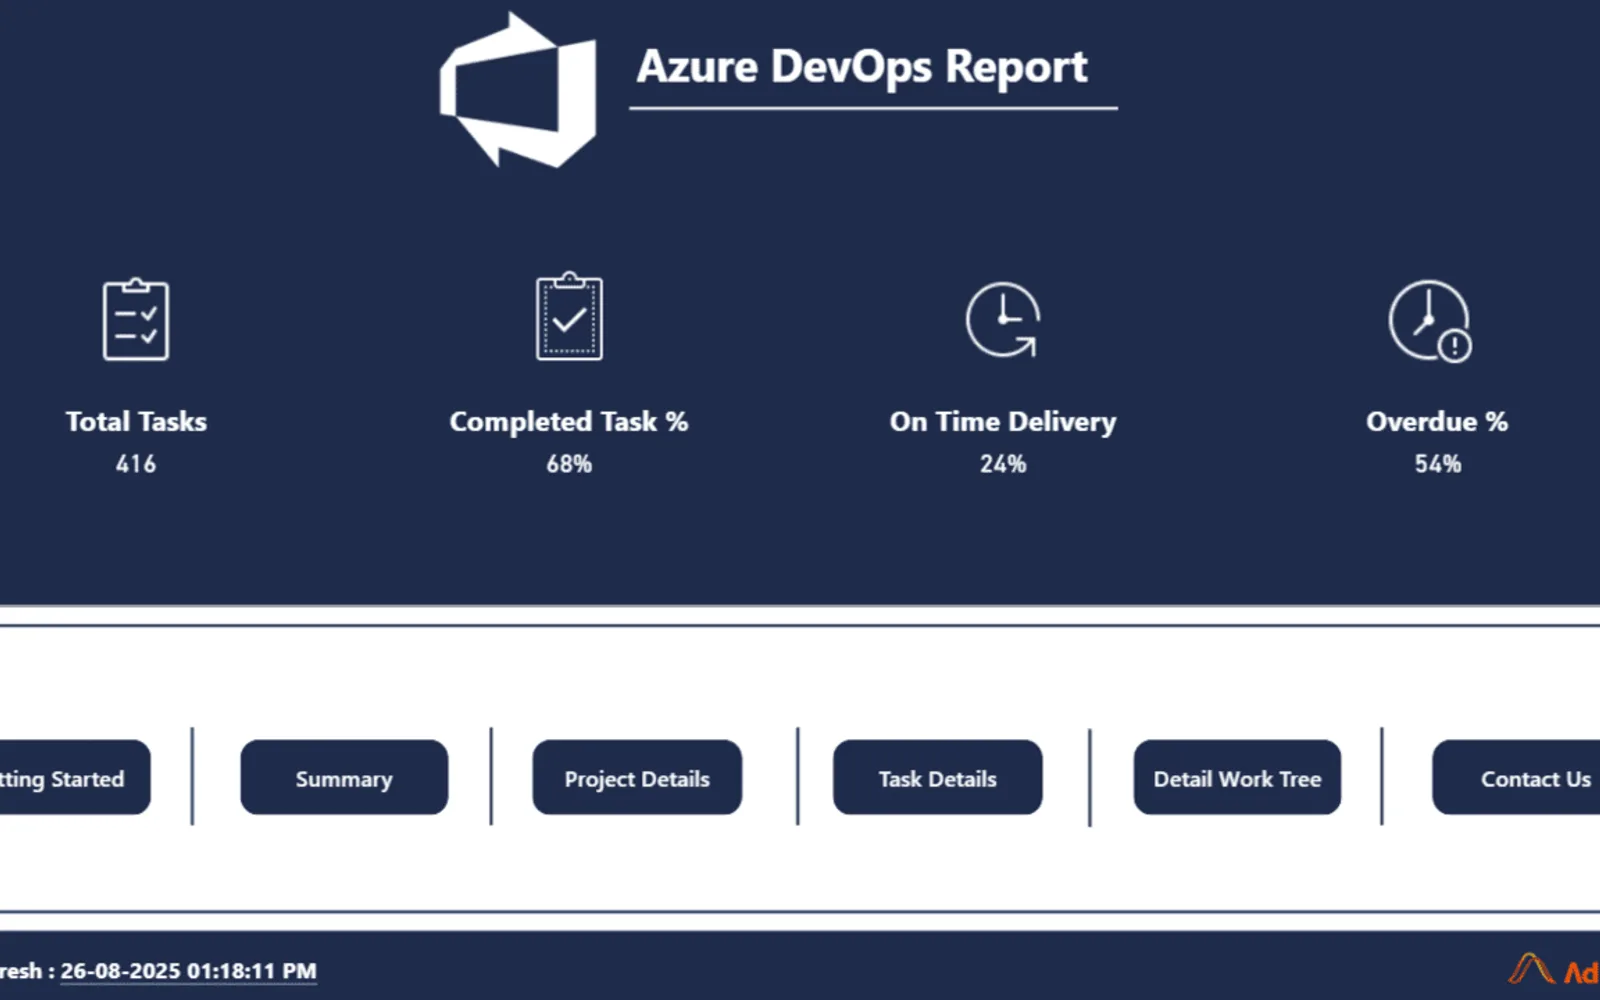
Provides Power BI reports for monitoring project and task activity. Views cover delivery duration, completion levels, task status, on-time delivery, overdue work, project resources, and task assignments. Users can break down results by source, department, project, and team member, then inspect related project and task details in a hierarchical view.
Reports task totals, project delivery duration, on-time delivery trends, task states, and overdue work.
Shows delivery metrics, task totals, and listed resources for each project.
Displays task delivery measures, annual task trends, completion totals, and completion percentages by resource.
Allows task analysis by source, department, project, and individual team member.
Maps project and task relationships alongside resource allocation and delivery time.
Organizations, project teams, and administrators managing Azure DevOps projects.
Azure DevOps Report uses a paid pricing model and cloud deployment. Turbo360 - FinOps and Cost Management for Azure uses a freemium pricing model with cloud deployment and has an update date of Aug 2026. StaffCircle uses cloud deployment, has an unknown pricing model, and has an update date of Jan 2025. Azure DevOps Report has an update date of Sep 2025.
| Name | Pricing | Deployment | Updated |
|---|---|---|---|
| this plugin | Paid | Cloud | |
| Turbo360 - FinOps and Cost Management for Azure | Freemium | Cloud | |
| StaffCircle | Price not published | Cloud |
1,365 plugins in Power BI · Analytics
Price distribution: 89 free, 137 freemium, 651 paid, 488 price not published
Provides Azure cost visibility, anomaly detection, and optimization recommendations to help organizations reduce spending.
Kovai Ltd
Turns Microsoft Teams into a performance management and culture system with reviews, feedback and engagement tracking.
StaffCircle Ltd
Gantt Chart is a project management visual for Microsoft Power BI that tracks schedules, milestones, and resource workloads.
ChartPad
Creates visualizations from diverse chart types, combines multiple charts on one canvas, and adds custom annotations and tooltips.
Akvelon«Azure DevOps Report Azure DevOps Report From Azure DevOps Report - Your Data, Connected! Azure DevOps Report provides a comprehensive view of project and task performance, starting with high-level KPIs on delivery timelines, completion rates, and task counts. Users can drill down into project-level details, explore …»