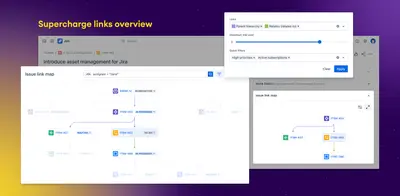
STAGIL Link Maps - Work links dependency & hierarchy graphs
Visualize Jira issue links, dependencies, and project hierarchies in interactive maps.
STAGIL by catworkxPaid
Create Jira tables and charts to sum, count, group, and display data.
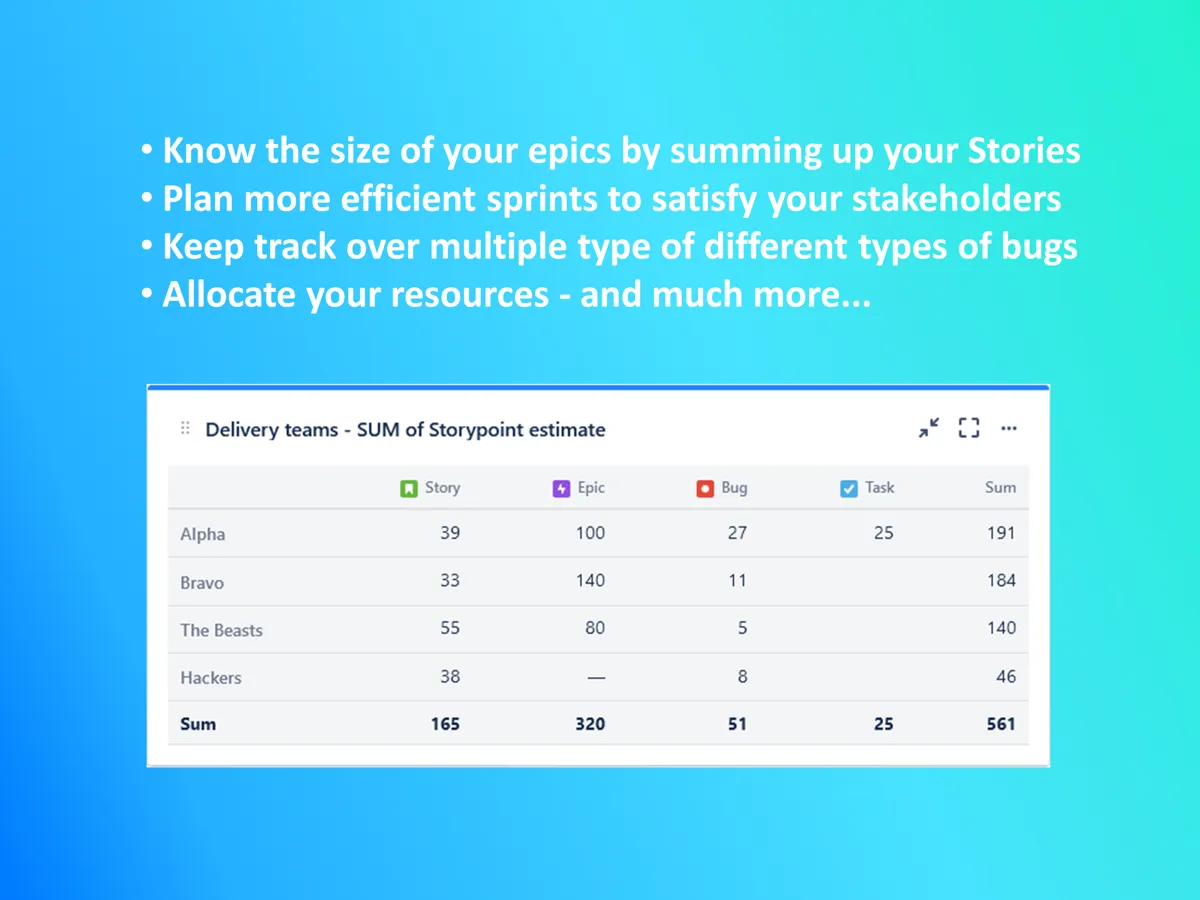
Provides table and chart gadgets for Jira data. The table gadget displays multiple data types, including sprint planning data, bug categories, and story points per person. A dependency wheel shows relationships between teams, while analytical charts present data visually for sharing.
Displays multiple types of Jira data in table format.
Shows dependencies between teams and relationships in delivery systems.
Creates charts to present Jira data visually and share it with others.
630 plugins in Jira · Data and analytics
Price distribution: 189 free, 230 freemium, 211 paid
Visualize Jira issue links, dependencies, and project hierarchies in interactive maps.
STAGIL by catworkx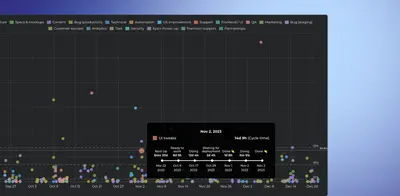
Creates charts and reports from Jira data, covering custom fields, sprints, worklogs, lead and cycle times.
Screenful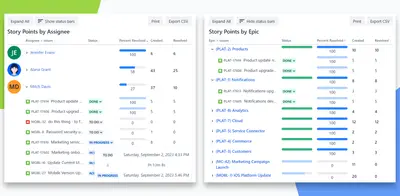
Track Jira project progress by summing issues, story points, or time estimates with configurable dashboard reports.
Agilis LT (Simple Reports)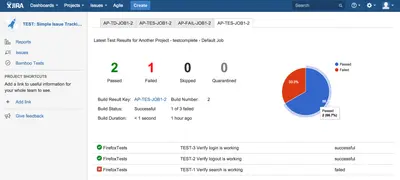
Displays Bamboo test results, statistics, charts, and build status in Jira project views and dashboard gadgets.
AutoTestingTools Software and Services pty ltd«Table and chart gadgets to sum up, count and group your data and display in a way that's easy to understand and to share Table gadget helps you display critical data: You can display multiple types of data to enable you do more efficient sprint plannings, overview different types of bugs, Storypoints per person and …»