
Power Plot Visual by Akvelon
Creates visualizations from diverse chart types, combines multiple charts on one canvas, and adds custom annotations and tooltips.
AkvelonFreemium
Collects sensor and operational data, then provides storage, analysis, and dashboard access.
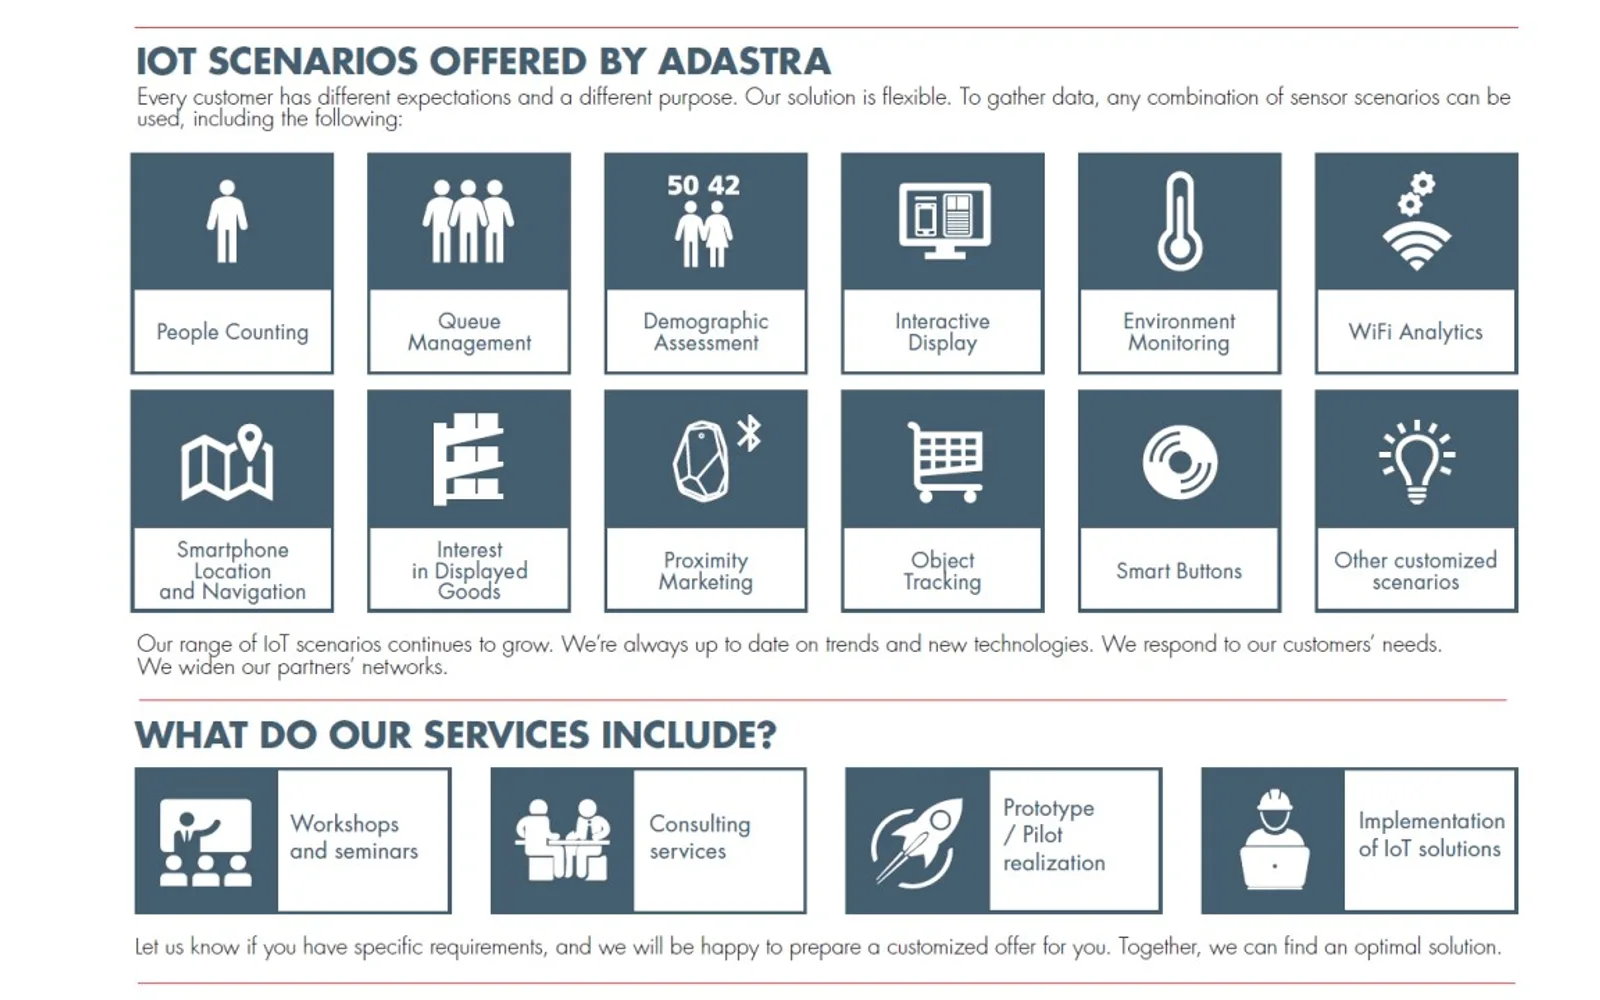
Gathers measurements from people counting, queue monitoring, face detection, tracking, digital tools, and applications. Combines information from these sources with operational-system data for processing, analysis, and storage. Makes data available to applications, reports, analysis workflows, and other systems. Includes dashboard creation, ad-hoc analysis, and publication through web and mobile access.
Captures measurements from counting, queue monitoring, face detection, tracking, digital tools, and application sources.
Processes information originating from IoT scenarios and operational systems.
Supports multiple storage approaches based on the data type and processing needs.
Provides interactive dashboards, ad-hoc analysis tools, and published dashboard access through browsers and mobile viewing.
2,531 plugins in Analytics
Price distribution: 125 free, 147 freemium, 1,350 paid, 909 price not published
Creates visualizations from diverse chart types, combines multiple charts on one canvas, and adds custom annotations and tooltips.
Akvelon
Creates financial and business reports in Power BI with automatic variance calculations, P&L logic, and drill-down (s5, s6).
Zebra BI
COSMO Text Module provides extended text management with a WYSIWYG editor for Microsoft Dynamics 365 Business Central.
COSMO CONSULT
Discover the why behind your data.
Data Courage«IoT scenarios providing acquisition of the necessary measurements / sensor data, including: • People Counting, Queue Management, Face Detection, Tracking, Digital tools data, Applications IoT platform provides: • Data processing (covering data from different sources, including data from IoT scenarios and data from …»