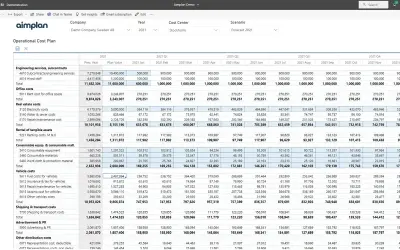
Aimplan Planning and Reporting Visual
Planning and reporting visual for Power BI that supports budgeting, forecasting, and financial reporting in one tool.
Aimplan ABPaid
Plan, edit, compare, and forecast data within Power BI charts.
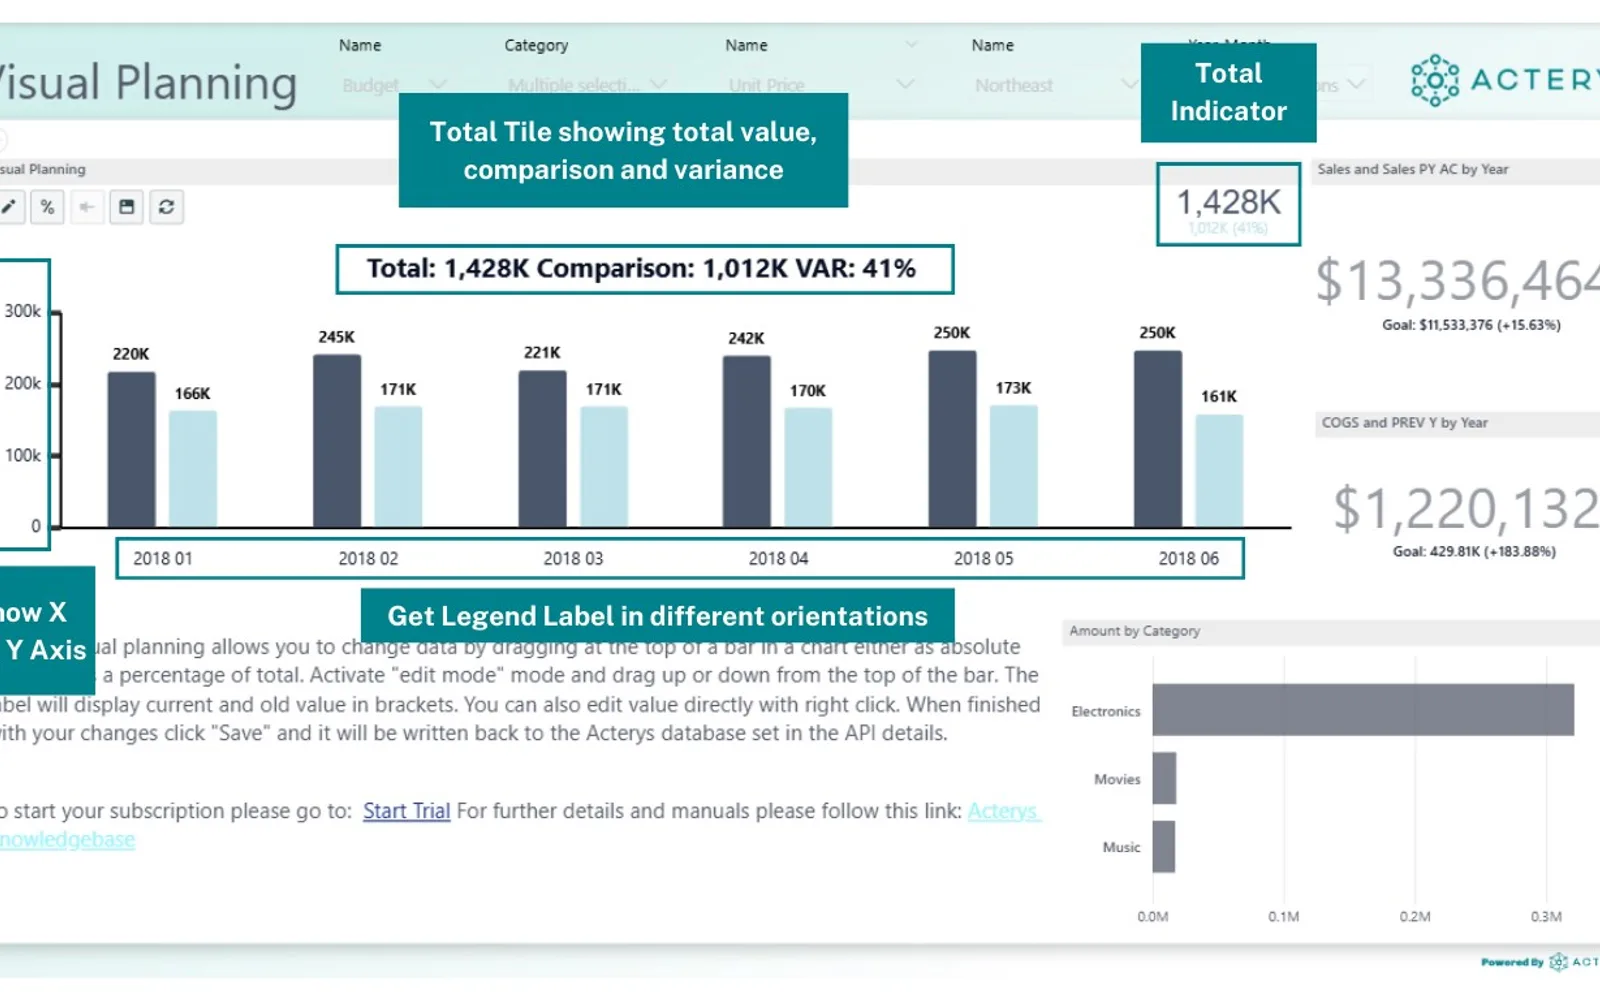
Provides write-back and planning functions inside Power BI bar, column, area, and line charts. Values can be entered as totals or percentages, then compared across planning scenarios. Selected data points can be locked while other values are redistributed. The visual also displays totals, variances, drill-down paths, tooltips, and links to detailed reports or data sets.
Change planning values directly within supported Power BI chart types.
Compare forecasting assumptions across multiple planning scenarios.
Enter data as absolute amounts or as percentages of totals.
Lock selected data points while redistributing other values.
Show totals and variance information within Power BI.
Use category drill-down, custom tooltips, and links to detailed reports or data sets.
893 plugins in Power BI · Analytics
Price distribution: 78 free, 115 freemium, 657 paid, 43 price not published
Planning and reporting visual for Power BI that supports budgeting, forecasting, and financial reporting in one tool.
Aimplan AB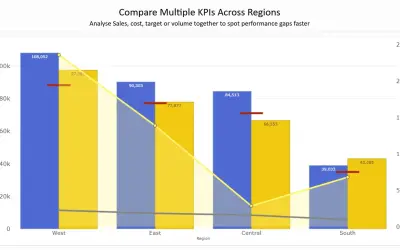
Combines column, line, area, and scatter charts on dual Y-axes to compare up to 8 metrics in a single Power BI visual.
PBIVizEdit.com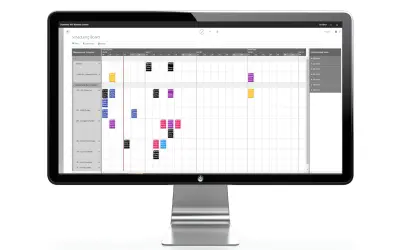
Dynaway Scheduling Board schedules work order jobs for asset technicians on a visual calendar in Dynamics 365 Business Central.
Dynaway A/S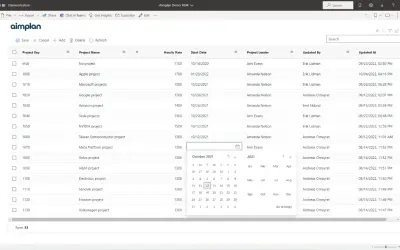
A Power BI visual that lets users edit and maintain data stored in the Aimplan Azure SaaS service or Azure SQL databases.
Aimplan AB«Acterys Visual Planning is a next-gen Power BI planning visual designed to revolutionize how organizations manage planning and forecasting. With an intuitive drag-and-drop planning interface in Power BI, users can update, compare, and lock values directly inside interactive bar, column, area, or line charts. Built for …»