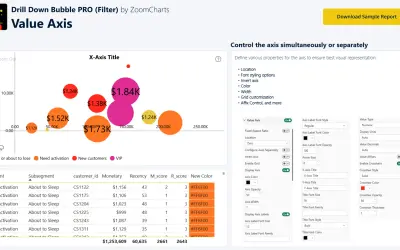
Drill Down Bubble PRO (Filter) by ZoomCharts
Drill Down Bubble PRO (Filter) provides interactive bubble charts with drill down and cross-chart filtering for Power BI.
ZoomChartsFreemiumCompare
16 apps
Drill Down Bubble PRO (Filter) provides interactive bubble charts with drill down and cross-chart filtering for Power BI.
ZoomCharts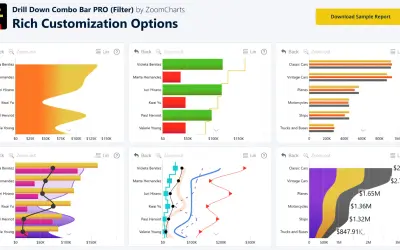
Sign up for a Free Developer License and get 1 year access to this and 20+ ZoomCharts visuals for use in Power BI Desktop!
ZoomCharts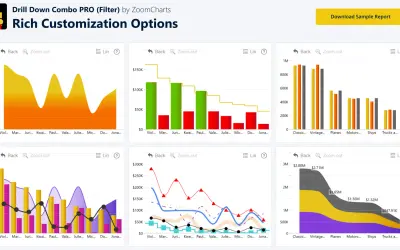
Drill Down Combo PRO (Filter) by ZoomCharts adds interactive drill-downs to column, line, and area charts in Power BI.
ZoomCharts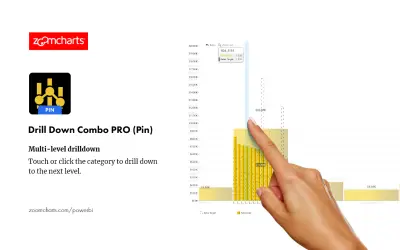
Adds column, line, and area chart types per series to Power BI dashboards, with stacking, clustering, and thresholds.
ZoomCharts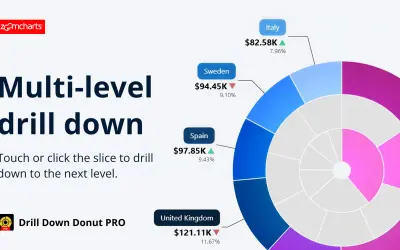
Drill Down Donut PRO is a KPI aware donut visual for Power BI, designed for performance reporting rather than simple category breakdowns.
ZoomCharts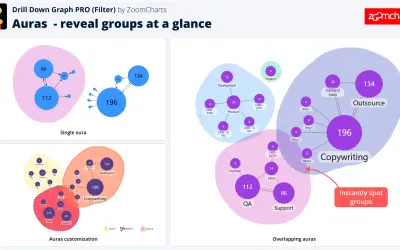
Drill Down Graph PRO (Filter) maps and explores graph data relations within Power BI using cross-chart filtering.
ZoomCharts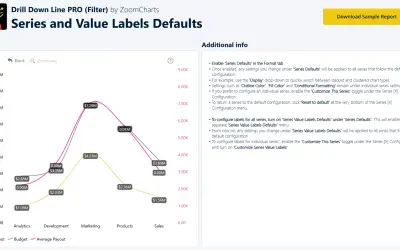
Drill Down Line PRO (Filter) provides interactive line charts with drill-down levels and cross-chart filtering for Power BI.
ZoomCharts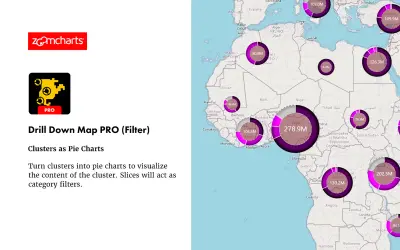
Drill Down Map PRO (Filter) by ZoomCharts visualizes and filters location data on interactive maps for Power BI Desktop reports.
ZoomCharts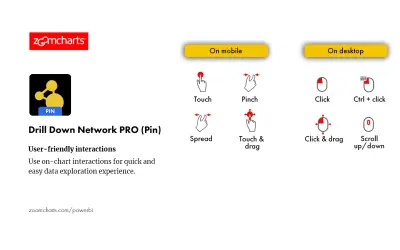
Drill Down Network PRO (Pin) by ZoomCharts renders interactive category-based network charts with drill-down support in Power BI.
ZoomCharts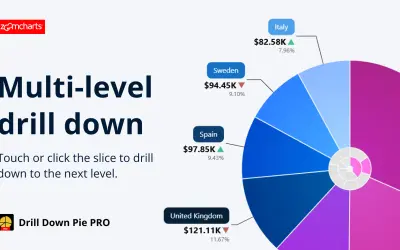
Power BI pie visual that combines drill down, per-category targets, and automatic others grouping in a single chart.
ZoomCharts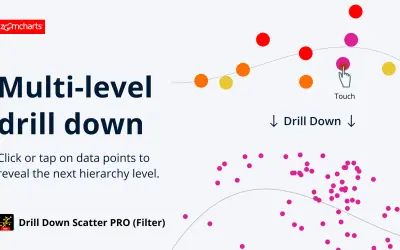
Drill Down Scatter PRO (Filter) by ZoomCharts provides interactive scatter plots with multi-level drill down for Power BI reports.
ZoomCharts
Sign up for a Free Developer License and get 1 year access to this and 20+ ZoomCharts visuals for use in Power BI Desktop!
ZoomCharts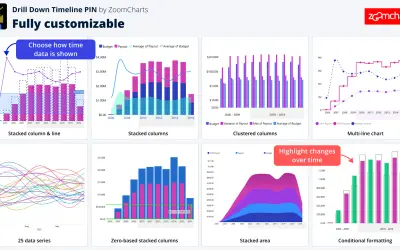
Interactive Power BI timeline visual that lets report viewers zoom, pan, and drill down into dense time-based data.
ZoomCharts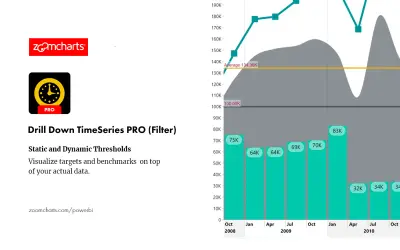
Power BI timeseries visual supporting up to 12 series, multiple chart types, on-chart drill down and cross-chart filtering.
ZoomCharts