Gauge Chart, Progress Bars & Counters for Jira Dashboards
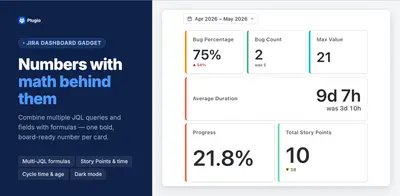
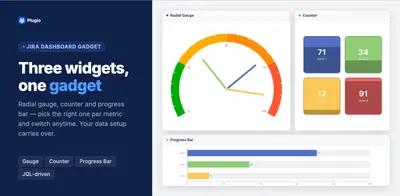
Display Jira query results as counters, gauges, or progress bars with targets and color zones.
PlugioFreeCompare
8 apps
Display Jira query results as counters, gauges, or progress bars with targets and color zones.
Plugio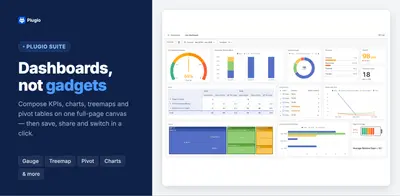
Create Jira dashboards with charts, reports, KPIs, filters, and JQL or sprint-based data scopes.
Plugio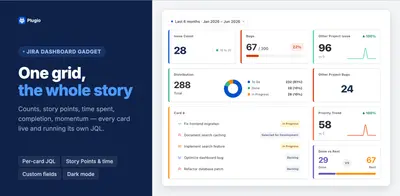
Build Jira KPI dashboards with JQL-filtered metric, trend, progress, comparison, distribution, and issue-list cards.
Plugio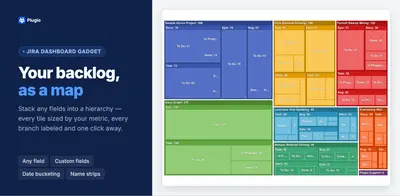
Create Jira dashboard treemap, sunburst, and pie charts with JQL filters, nested issue fields, drill-down views, and metric-based sizing and coloring.
Plugio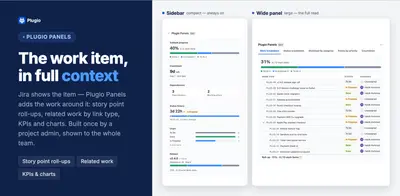
Adds roll-ups, progress views, KPIs, charts and related-issue panels to Jira work items.
Plugio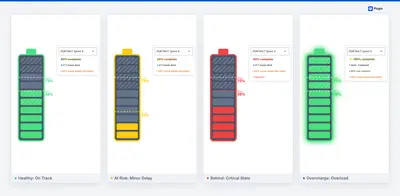
Track Jira sprint pace with a battery-style dashboard for health, scope changes, and issue breakdowns.
Plugio