Zebra AI
Creates interactive dashboards with AI-driven explanations, forecasts, and recommendations from uploaded business data.
Zebra BIPaid
Automates sensitivity, risk, scenario, and dashboard analysis in PowerPoint.
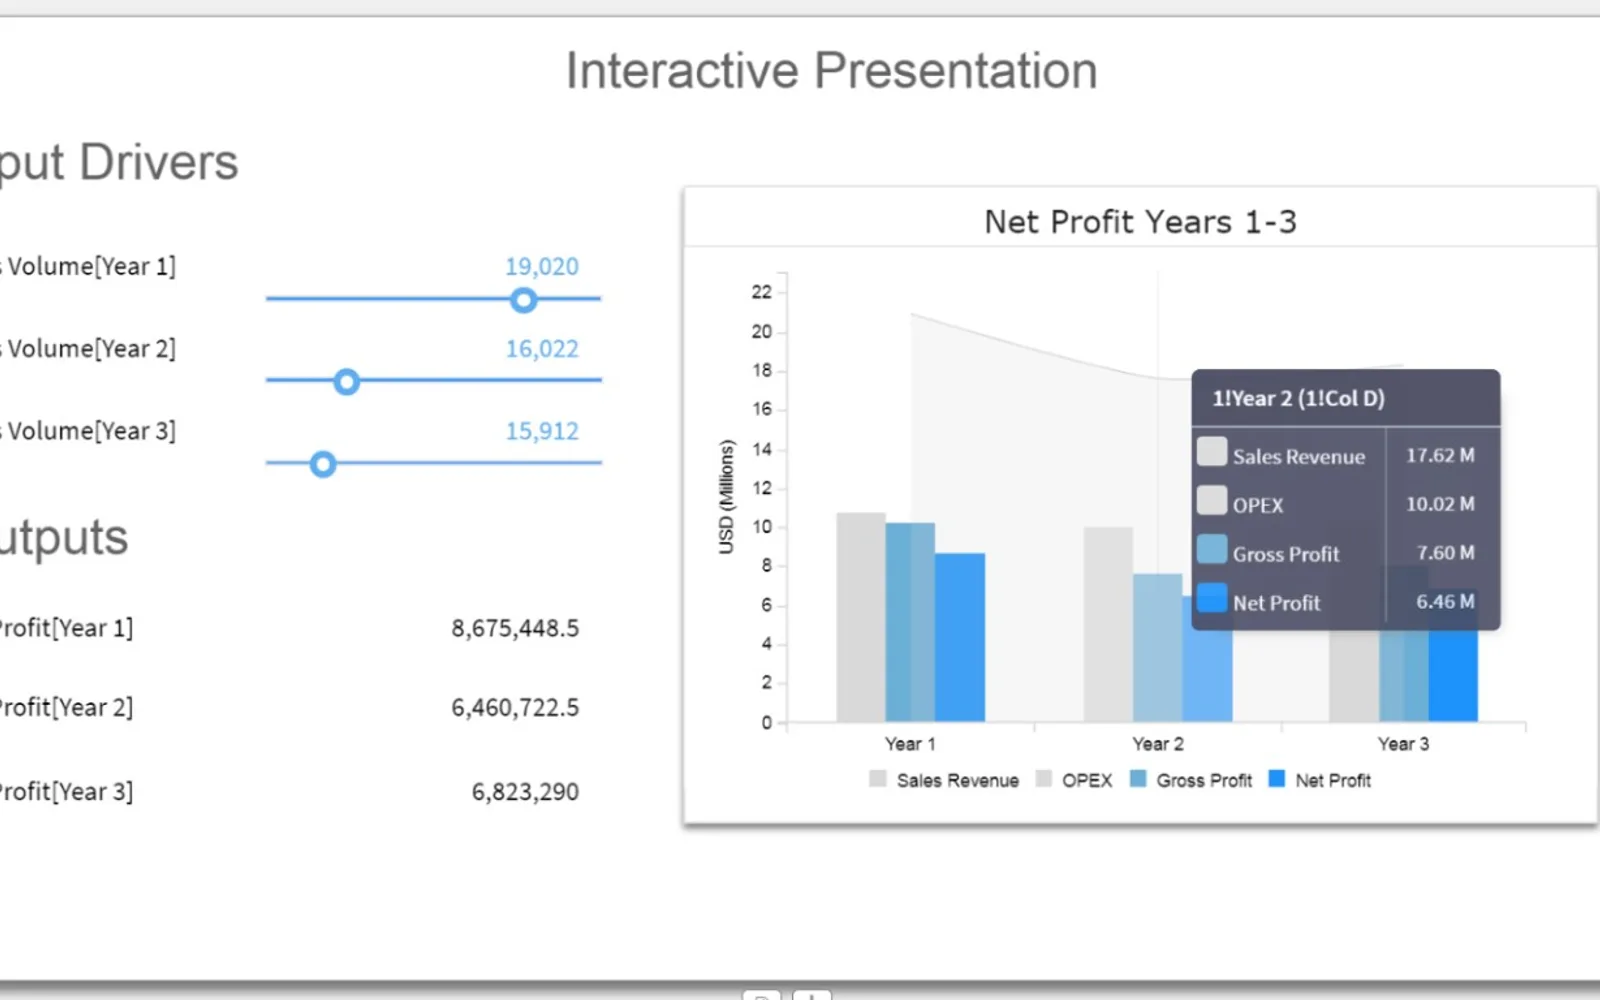
Visyond analyzes a selected decision KPI, such as ROI, NPV, revenues, or expenses. It identifies input cells that affect KPIs, shows sensitivities and scenarios, and analyzes project risks with Monte Carlo simulation. Analyses can be placed on online dashboards and shared with selected stakeholders. The add-in depends on the Visyond web service and requires an active internet connection.
Analyzes a selected decision KPI and identifies the input cells that impact KPIs.
Shows the sensitivities of KPIs to their drivers.
Shows scenarios that are created or auto generated.
Analyzes project risks using Monte Carlo simulation.
Places analyses on online dashboards for sharing with selected stakeholders.
Visyond is for stakeholders who need to access or share analyses.
Visyond and Zebra AI both use cloud deployment, but Visyond has an unknown pricing model while Zebra AI is paid. Visyond and Lucidspark Boards for PowerPoint both have unknown pricing models and cloud deployment. Visyond was updated on Nov 2022, while Lucidspark Boards for PowerPoint was updated on Mar 2024.
| Name | Pricing | Deployment | Updated |
|---|---|---|---|
| this plugin | Price not published | Cloud | |
| Zebra AI | Paid | Cloud | |
| Lucidspark Boards for PowerPoint | Price not published | Cloud |
107 plugins in PowerPoint · Analytics
Price distribution: 8 free, 4 freemium, 18 paid, 77 price not published
Creates interactive dashboards with AI-driven explanations, forecasts, and recommendations from uploaded business data.
Zebra BI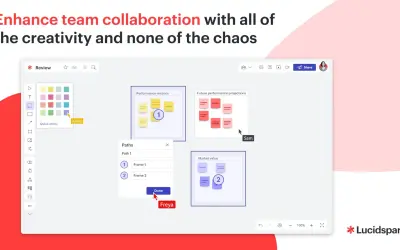
Adds Lucidspark boards to Microsoft PowerPoint presentations to communicate brainstorming and decision-making processes.
Lucid Software Inc
Adds GovDash's Dash AI to Word, Excel, and PowerPoint for proposal questions, section drafting, pricing, and slides.
Realize, Inc.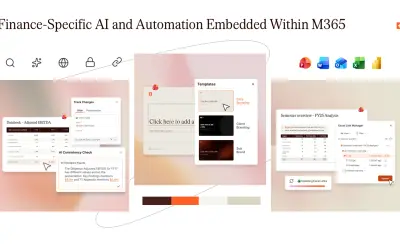
UpSlide turns AI-generated content into on-brand client deliverables within Microsoft 365 for financial services teams.
UpSlide«Automate sensitivity and risk analyses, scenarios, and dashboards You will, in real time, visualize: - The key input cells that impact your KPIs (e.g., revenues, costs, profits, headcount, ROI, etc.). Often this also uncovers formula errors. - The sensitivities of the KPIs to those drivers; - The scenarios created or …»