AtlassianAL
Cloud Counter for Confluence
Counts selected resources in a Confluence Cloud instance using Confluence APIs.
AlluviumFreemium
Create line charts from Confluence data tables.
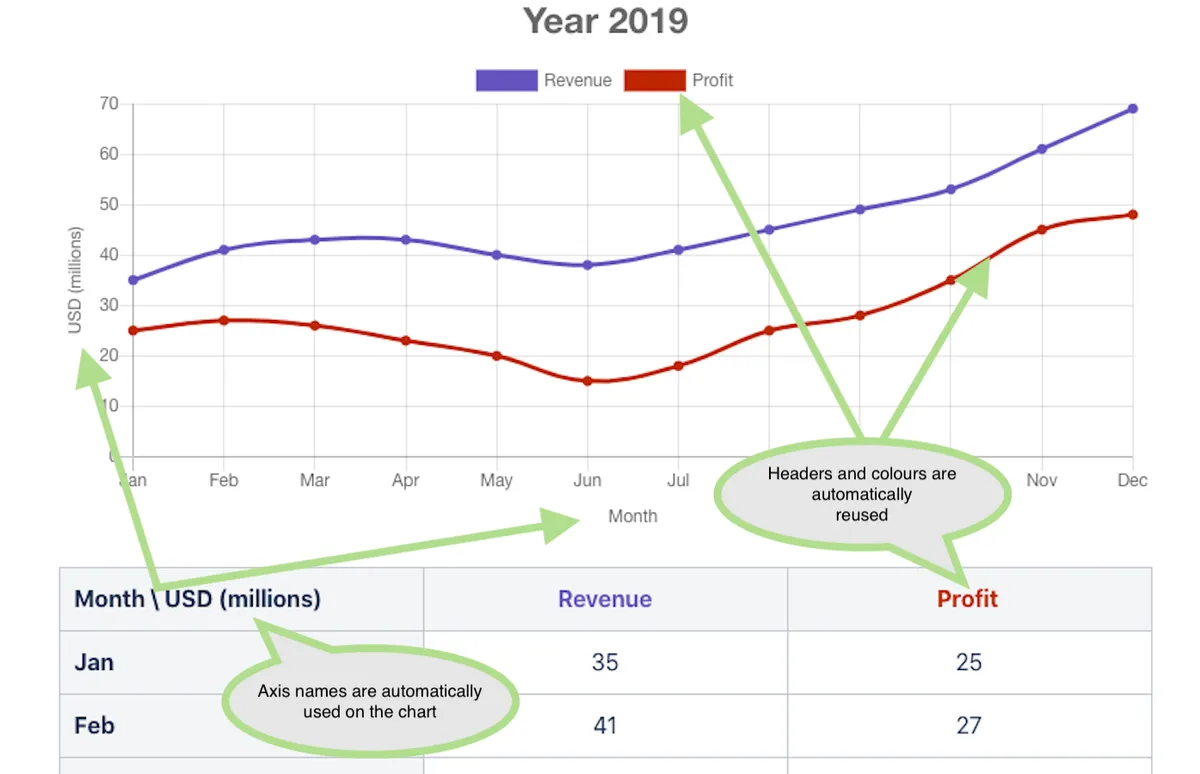
Converts Confluence data tables into charts on the page. The vendor states that it supports line charts and uses Chart.js under the MIT license.
Converts data tables on a Confluence page into charts.
Supports line charts for Confluence data tables.
Works with existing data on the page.
192 plugins in Confluence · Data and analytics
Price distribution: 47 free, 81 freemium, 64 paid
Counts selected resources in a Confluence Cloud instance using Confluence APIs.
Alluvium
Adds a searchable Q&A forum to Confluence with voting, tags, permissions, and notifications.
Firnity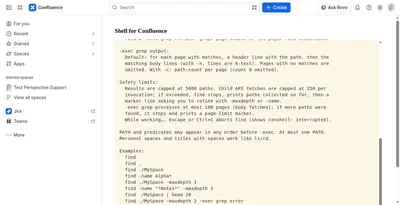
Manage Confluence pages through a command-line-style console for navigation, search, viewing, copying, and moving.
Kenputer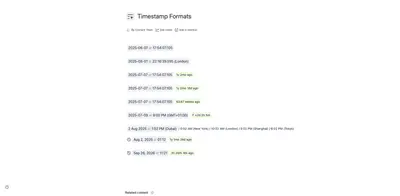
Adds natural-language timestamps, timezone conversions, countdowns, and ISO copying to Confluence pages.
Crenwiz«Simple Charts for Confluence is the best way to make your data more attractive and easy to read. Addon visualises the data tables on the page converting it to colourful graphs and charts for better representation. Feel free to review the live demo page . Core features: Easy to configure Works well with existing data …»