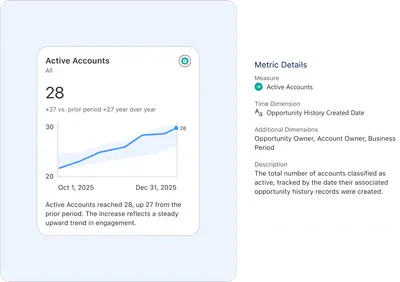
Sales Insights Model and Metrics
Provides sales metrics and calculated fields for analytics in Tableau, Agentforce Sales, and Data 360.
Salesforce LabsFree
Analyzes sales quota attainment and performance comparisons in Tableau.

The accelerator shows monthly revenue achievement against a specific quota for regions, territories, and sellers. Its performance comparison dashboard provides year-over-year context. It identifies rankings, quota attainment patterns, median performance, and the percentage of associates reaching quota.
Shows monthly revenue achievement against a specific quota.
Provides quota performance visibility for regions, territories, and sellers.
Compares sales performance with prior periods.
Determines how sales teams rank against one another.
Shows which sellers rank highest by performance.
Identifies sellers or teams that consistently reach quota.
Reports median quota attainment, median performance percentage, and the percentage of associates reaching quota.
Determines associate rank.
Sales Performance focuses on monthly quota attainment, seller and team rankings, and year-over-year performance comparison. Sales Insights Model and Metrics provides a sales semantic model for Agentforce Sales, Data 360, and Tableau Next, with 15+ pre-configured metrics and 60+ calculated fields.
| Name | Pricing | Deployment | Updated |
|---|---|---|---|
| this plugin | Free | Cloud | Not published |
| Sales Insights Model and Metrics | Free | Cloud |
56 plugins in Tableau · Sales
Price distribution: 31 free, 2 freemium, 23 paid
Provides sales metrics and calculated fields for analytics in Tableau, Agentforce Sales, and Data 360.
Salesforce Labs
Runs sales gamification in Tableau with competitions, leaderboards, recognition, coaching tools, and performance tracking.
Spinify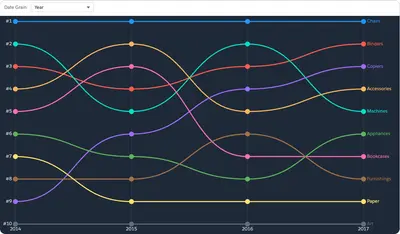
Visualizes metric rank changes across dimensions and time in Tableau.
Salesforce Labs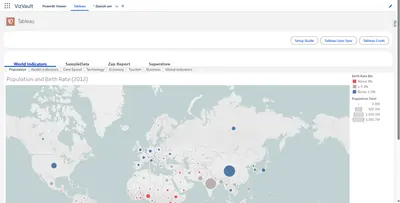
Connects Tableau and Power BI dashboards to Salesforce for access management and viewing in Lightning.
CloudEarly DWC-LLC«The Accelerator for Sales Performance depicts monthly revenue achievement towards a specific quota (performance.) It provides immediate visibility into quota performance for regions, territories, and sellers. The Performance Comparison dashboard provides year over year context for performance. Determines how sales …»