Pageview Analytics

by codevectorAtlassianFreemium

Analyzes Confluence page views in Space Settings with ranked tables, trend charts, filters, and report publishing.

Facts verified marketplace.atlassian.comAd-free rankings
PRICINGFreemium
DEPLOYMENTCloud
CATEGORYData and analytics
UPDATED ON MARKETPLACE
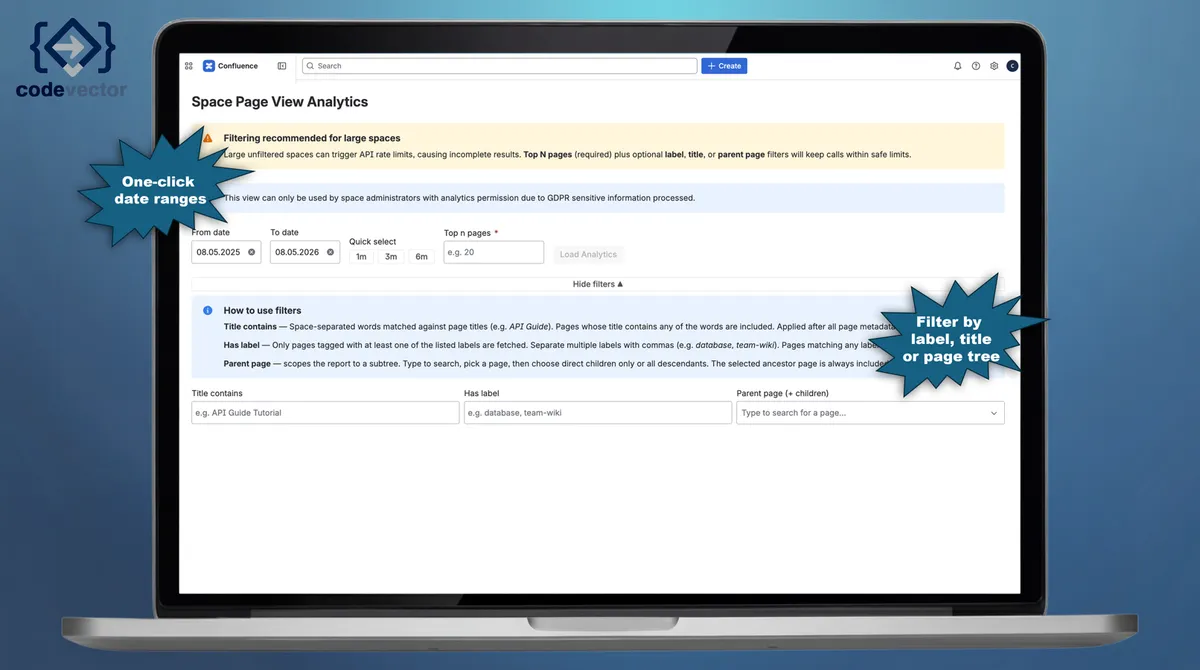
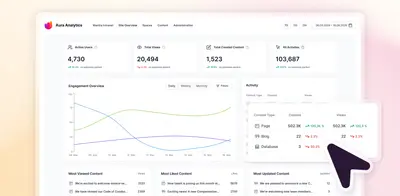
Pageview Analytics — screenshot from the Atlassian Marketplace listing

What it does

Pageview Analytics ranks Confluence pages by views and displays traffic trends within Space Settings. Administrators select a date range, apply filters by label, title, or page tree, and load analytics. Reports containing the trend chart and rankings table can be published as Confluence pages. The vendor states that the add-in processes aggregate views without displaying user data and uses no external servers.

Key capabilities

from the Atlassian Marketplace listing

Ranked page tables

Displays a sortable table of pages ranked by view count.

Traffic trend charts

Shows daily, weekly, or monthly traffic charts over time.

Analytics filters

Filters analysis by label, page title, or parent page subtree.

Published reports

Publishes a Confluence page containing the trend chart and rankings table.

Aggregate view data

Uses aggregate views without processing or displaying user data, according to the vendor.

Who it's for

Space administrators.

How it compares

Pageview Analytics is freemium, while AURA Analytics for Confluence (Charts Insights Reports FREE) is free. Both are cloud deployments.

NamePricingDeploymentUpdated
Pageview Analyticsthis pluginFreemiumCloud
AURA Analytics for Confluence (Charts Insights Reports FREE)FreeCloud

In the catalog

192 plugins in Confluence · Data and analytics

Price distribution: 47 free, 81 freemium, 64 paid

Pricing & deployment

Platform
Atlassian
Product
Confluence
Deployment
Cloud
Pricing
Freemium

More from codevector

Similar plugins in Confluence · Data and analytics

View all 192 →

What the vendor says

«Page View Analytics — Know What Your Team Actually Reads Your team creates hundreds of pages — but which ones are actually read? Now you'll know. ✅ Open Space Settings → Pick a date range → Load Analytics. Done. 🔹 📊 Ranked page view table — top pages sorted by impact 🔹 📈 Trend chart — engagement over time …»

Official marketplace listing

Publisher
codevector
Updated on marketplace
Facts verified

Tags

analyticscharts/graphsdata visualisationreporting