
Gantt Chart
Gantt Chart is a project management visual for Microsoft Power BI that tracks schedules, milestones, and resource workloads.
ChartPadFree
Calculate MTM benchmark times and create pictogram-based process descriptions for manufacturing workflows.
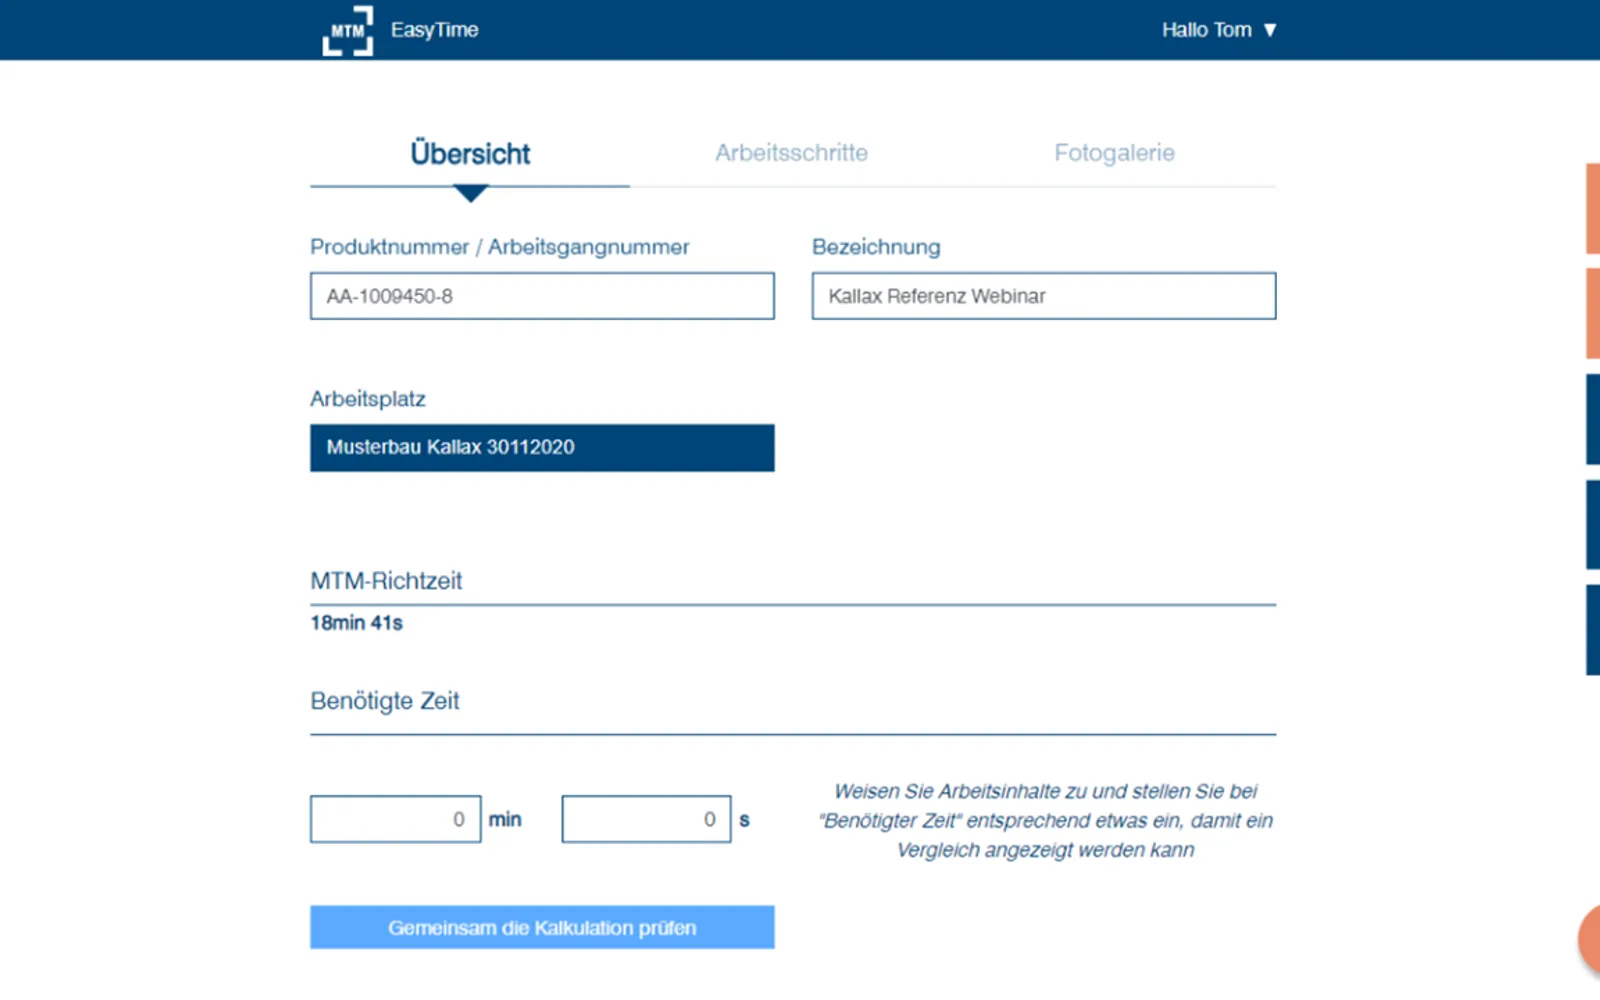
Calculates MTM benchmark times based on different workplace organisations. Creates and manages pictogram-based process descriptions for products, compares benchmark times with existing assembly times, and provides hints for workplace organisation. It also creates work instructions for shopfloor worker guidance.
Creates and manages pictogram-based process descriptions for products.
Calculates MTM benchmark times based on different workplace organisations.
Compares benchmark times with existing assembly times.
Creates work instructions for shopfloor worker guidance.
163 plugins in Project Management
Price distribution: 9 free, 5 freemium, 48 paid, 101 price not published
Gantt Chart is a project management visual for Microsoft Power BI that tracks schedules, milestones, and resource workloads.
ChartPad
Clever Document Delivery sends transaction documents as password-protected PDF emails for Microsoft Dynamics 365 Business Central.
Clever Dynamics
FaVa supports fashion processes from product development to sales and finance on Microsoft Dynamics 365 Business Central.
XtensionIT Aps
Manages team tasks inside Microsoft 365, surfacing them in Teams, Outlook, and Calendar with AI agent support via MCP.
RECEIPTROLLER«MTM-Easy® enables you to calculate MTM benchmark times. Low unit costs, safeguarding delivery capacity, being well ahead of the competition? If you want to know what your production department can really achieve, then ensure that processes are transparent and calculate benchmark times using MTM-Easy® – simply …»