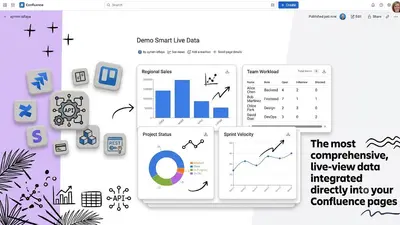
Smart Live Data: API Dashboards for Confluence
Create API-powered dashboards, reports, tables, metric cards, and badges in Confluence.
AdeliekitFreemium
Bring Grafana monitoring views and Rovo context into Confluence runbooks and incident pages.
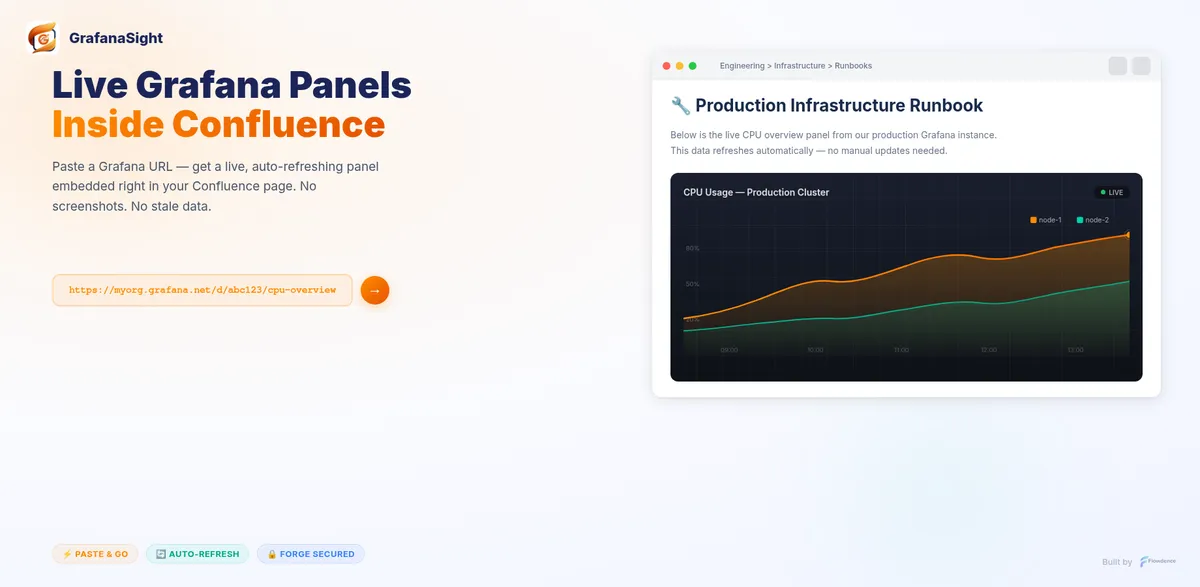
GrafanaSight converts Grafana or GrafanaSight links added to Confluence into embedded monitoring views, including panel snapshots, dashboard summaries, alert information, service-health bylines, and annotation timelines. Space administrators associate a Confluence space with a Grafana destination using a service account token held in Forge secret storage, while Atlassian administrators approve the destination before requests are sent. Its Rovo Specialist responds using cached dashboard, alert, annotation, and freshness information.
Links added to Confluence can become Grafana panel snapshots or automatically refreshing panels.
The add-in presents dashboard panel breakdowns, alert information, and status badges in Confluence.
Grafana or GrafanaSight links can generate service-health bylines on Confluence pages.
The add-in can display annotation timelines from Grafana or GrafanaSight links.
The Rovo Specialist answers questions from cached dashboard, alert, annotation, and freshness data.
Space administrators can associate Confluence spaces with Grafana instances through a service account token stored in Forge secret storage.
The vendor names SRE, platform, and operations teams, as well as space administrators and Atlassian administrators.
GrafanaSight and Smart Live Data: API Dashboards for Confluence both use freemium pricing and cloud deployment. The listing date for GrafanaSight is Sep 2026; the alternative's update date is Aug 2026.
| Name | Pricing | Deployment | Updated |
|---|---|---|---|
| this plugin | Freemium | Cloud | |
| Smart Live Data: API Dashboards for Confluence | Freemium | Cloud |
192 plugins in Confluence · Data and analytics
Price distribution: 47 free, 81 freemium, 64 paid
Create API-powered dashboards, reports, tables, metric cards, and badges in Confluence.
Adeliekit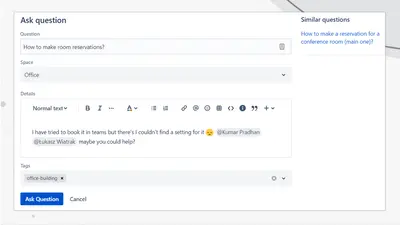
Adds a searchable Q&A forum to Confluence with voting, tags, permissions, and notifications.
Firnity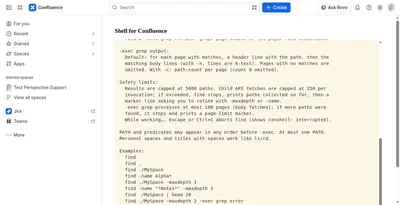
Manage Confluence pages through a command-line-style console for navigation, search, viewing, copying, and moving.
Kenputer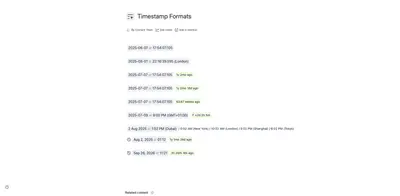
Adds natural-language timestamps, timezone conversions, countdowns, and ISO copying to Confluence pages.
Crenwiz«GrafanaSight helps SRE, platform, and operations teams keep Confluence runbooks, incident pages, and postmortems aligned with Grafana Cloud or self-hosted HTTPS Grafana instances. Authors can paste Grafana or GrafanaSight links into Confluence and turn them into panel snapshots, dashboard overviews, alert summaries …»