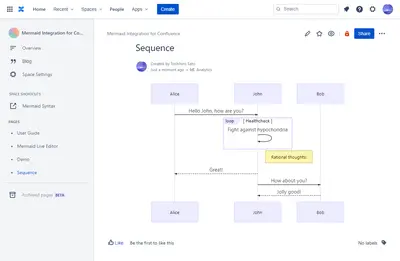
Mermaid Integration for Confluence
Embed Mermaid charts and diagrams in Confluence pages, with a live editor for editing and previewing them.
Toshihiro SatoPaid
Create SVG flowchart diagrams from textual process descriptions in Confluence.
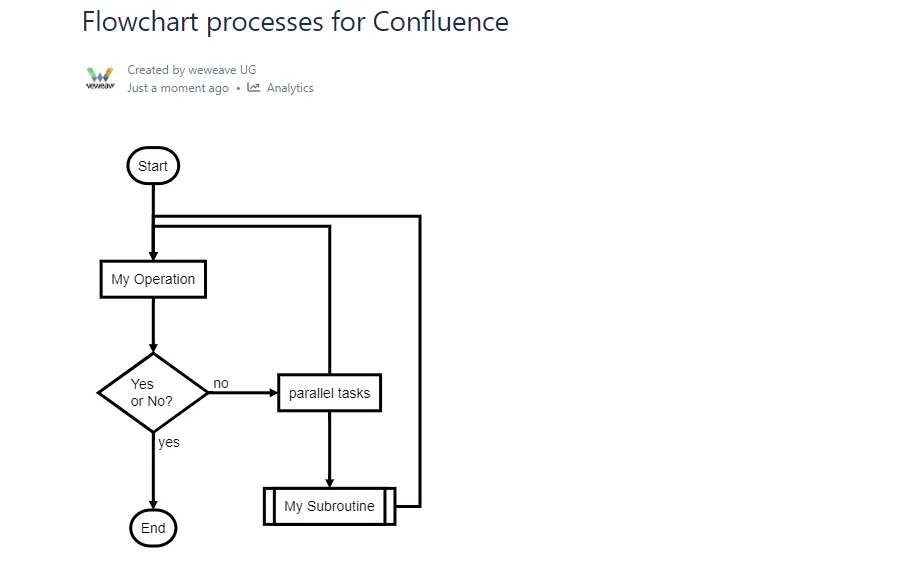
Adds a Confluence macro that converts textual descriptions into SVG flowchart diagrams. Flowcharts use a documented domain-specific language. Nodes and connectors can be reused, changed, and styled individually. Flowcharts can be previewed in edit mode, and the add-in supports Confluence dark mode.
Creates flowcharts from descriptions written in a domain-specific language.
Supports reusing nodes within flowchart definitions.
Allows connectors to be changed in flowchart definitions.
Styles nodes and connectors separately.
Renders flowcharts as SVG diagrams.
Supports Confluence dark mode.
Flowchart Processes for Confluence is freemium and cloud-only, while Mermaid Integration for Confluence is paid and supports data-center, cloud, and server deployment. PlantUML, Mermaid UML, Graphviz for Confluence is freemium and supports server, cloud, and data-center deployment.
| Name | Pricing | Deployment | Updated |
|---|---|---|---|
| this plugin | Freemium | Cloud | |
| Mermaid Integration for Confluence | Paid | Cloud · Data Center · Server | |
| PlantUML, Mermaid UML, Graphviz for Confluence | Freemium | Cloud · Data Center · Server |
990 plugins in Confluence · Content and communication
Price distribution: 228 free, 378 freemium, 384 paid
Embed Mermaid charts and diagrams in Confluence pages, with a live editor for editing and previewing them.
Toshihiro Sato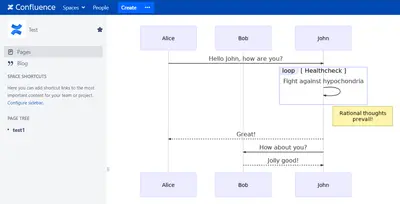
Render UML, Mermaid UML and Graphviz diagrams in Confluence from plain-text definitions.
Fulstech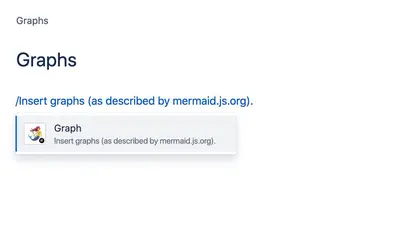
Display Mermaid-described graphs on Confluence pages using a macro.
Bertly
Add Mermaid diagrams with live editing, templates, and Rovo features inside Confluence.
NGPILOT«Flowchart Processes for Confluence provides a macro that turns textual descriptions into SVG flow chart diagrams. This allows you to easily visualize your processes in Confluence. The diagrams are described in the flowchart DSL that is documented here https://github.com/adrai/flowchart.js#flowchartjs .»