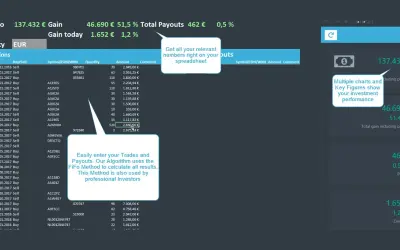
DIY Portfolio Manager
Tool for Excel that tracks investment portfolios with automatic stock quotes, FiFo calculations, and key performance indicators.
yaicoPrice not published
Brings dividend, financial statement, ratio, quote, and estimate data into Excel through custom formulas.
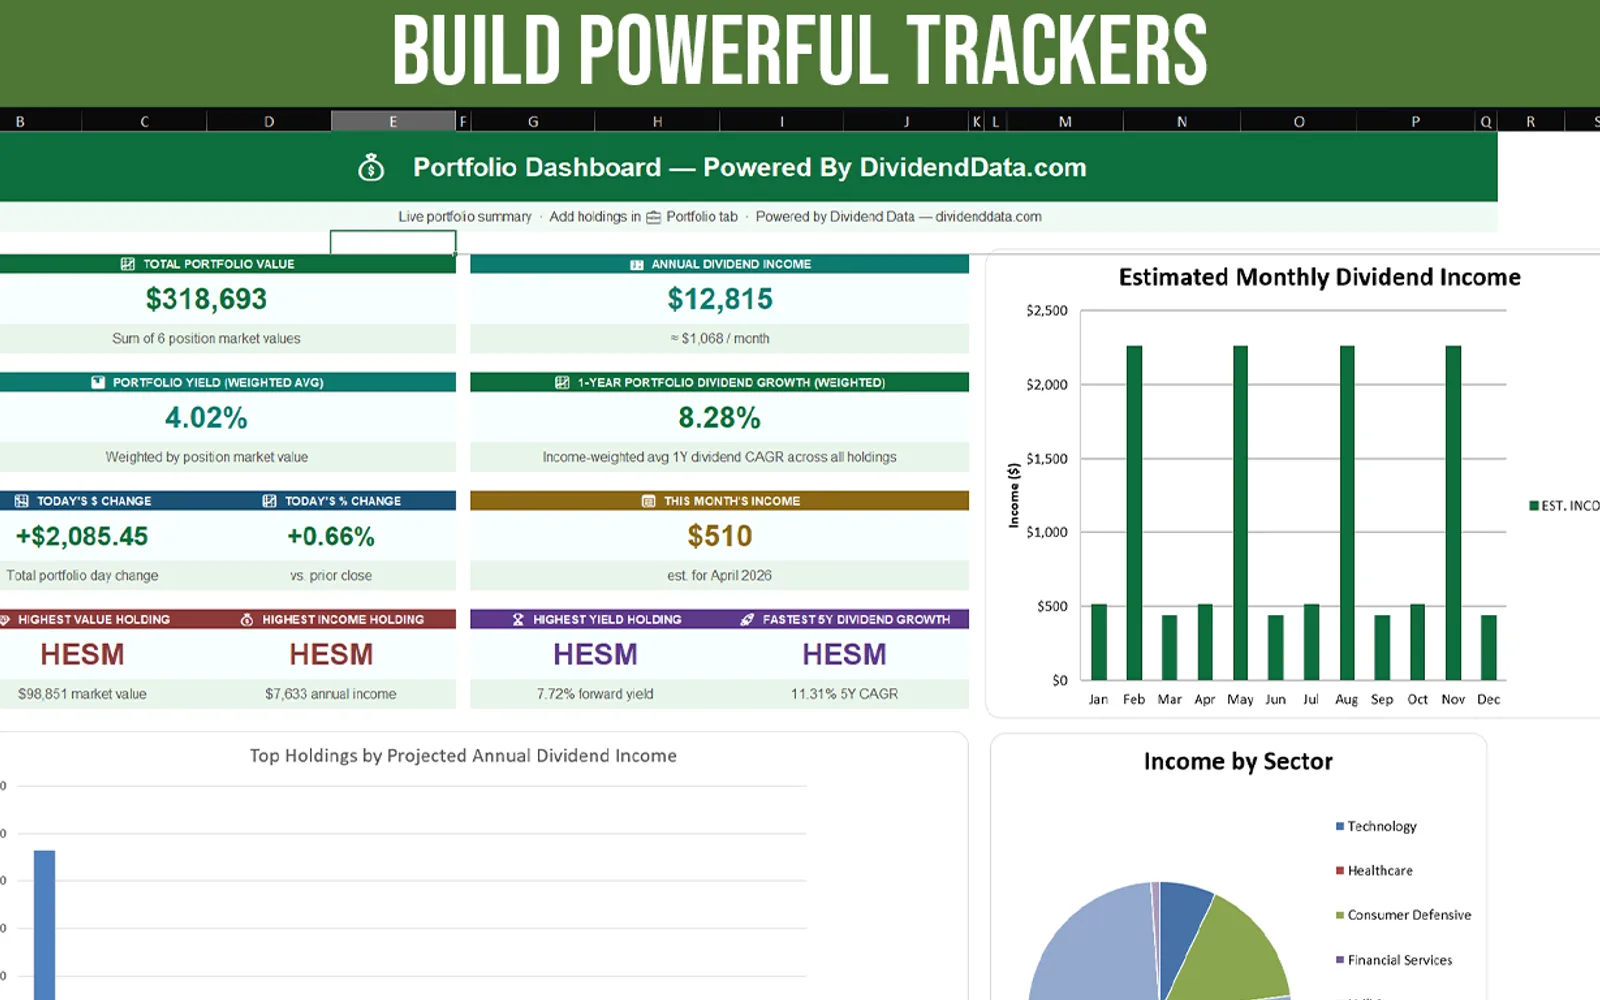
Dividend Data provides financial data in Excel through custom functions. Functions cover dividends, financial statements, metrics, ratios, quotes, and analyst estimates. Dividend data includes payment dates, ex-dividend dates, growth rates, payout ratios, CAGRs, payment frequency, and expected payments. The add-in also includes formula building, batch queries, quick data insertion, and spreadsheet auto-refresh.
Provides dividend history, growth rates, payout ratios, ex-dividend dates, payment dates, declaration dates, CAGRs, payment frequency, and expected payments.
Retrieves income statement, balance sheet, and cash flow data.
Provides financial metrics and ratios including P/E, ROE, and debt ratios.
Provides real-time prices, moving averages, analyst forecasts, and price targets.
Provides a visual tool for building custom formulas.
Retrieves data for multiple stocks at once.
Refreshes spreadsheet data automatically.
Built for dividend and value investors.
Dividend Data, IEX Cloud Stock Data, DIY Portfolio Manager, and Financial Modeling Prep all use cloud deployment and have an unknown pricing model. Dividend Data has a listed update date of Apr 2026, compared with Jan 2023 for IEX Cloud Stock Data, Nov 2022 for DIY Portfolio Manager, and May 2024 for Financial Modeling Prep.
| Name | Pricing | Deployment | Updated |
|---|---|---|---|
| this plugin | Price not published | Cloud | |
| IEX Cloud Stock Data | Not in catalog | ||
| DIY Portfolio Manager | Price not published | Cloud | |
| Financial Modeling Prep | Price not published | Cloud | |
446 plugins in Excel · Analytics
Price distribution: 8 free, 17 freemium, 142 paid, 279 price not published
Tool for Excel that tracks investment portfolios with automatic stock quotes, FiFo calculations, and key performance indicators.
yaico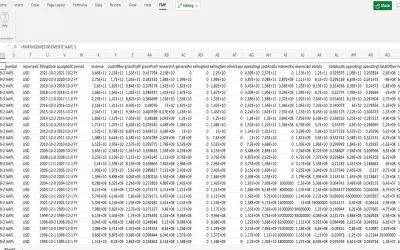
Via this Excel Add-in you will be able to querying Financial Modeling Prep market data.
Financial Modeling Prep SAS
Button-based slicer for Power BI that can be arranged horizontally or as a matrix, with cross highlighting and image support.
Microsoft Corporation
Automates formulas, data cleanup, reporting, and bulk row-by-row tasks in Microsoft Excel from plain-language prompts.
TALARIAN S. à r.l.«1.6; color: #333; } h2 { font-size: 18px; font-weight: 600; margin-top: 24px; margin-bottom: 12px; color: #2f2f2f; } h3 { font-size: 16px; font-weight: 600; margin-top: 18px; margin-bottom: 8px; color: #2f2f2f; } p { margin-bottom: 12px; } ul { margin-bottom: 16px; padding-left: 20px; } li { margin-bottom: 6px; } …»