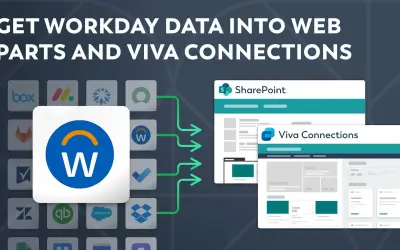
Workday integration by adenin
Displays Workday data in SharePoint through a customizable Web part and in Viva Connections via an Adaptive Card extension.
adenin TECHNOLOGIES IncPrice not published
Create interactive charts and dashboards from SharePoint lists and libraries, with sharing and export options.
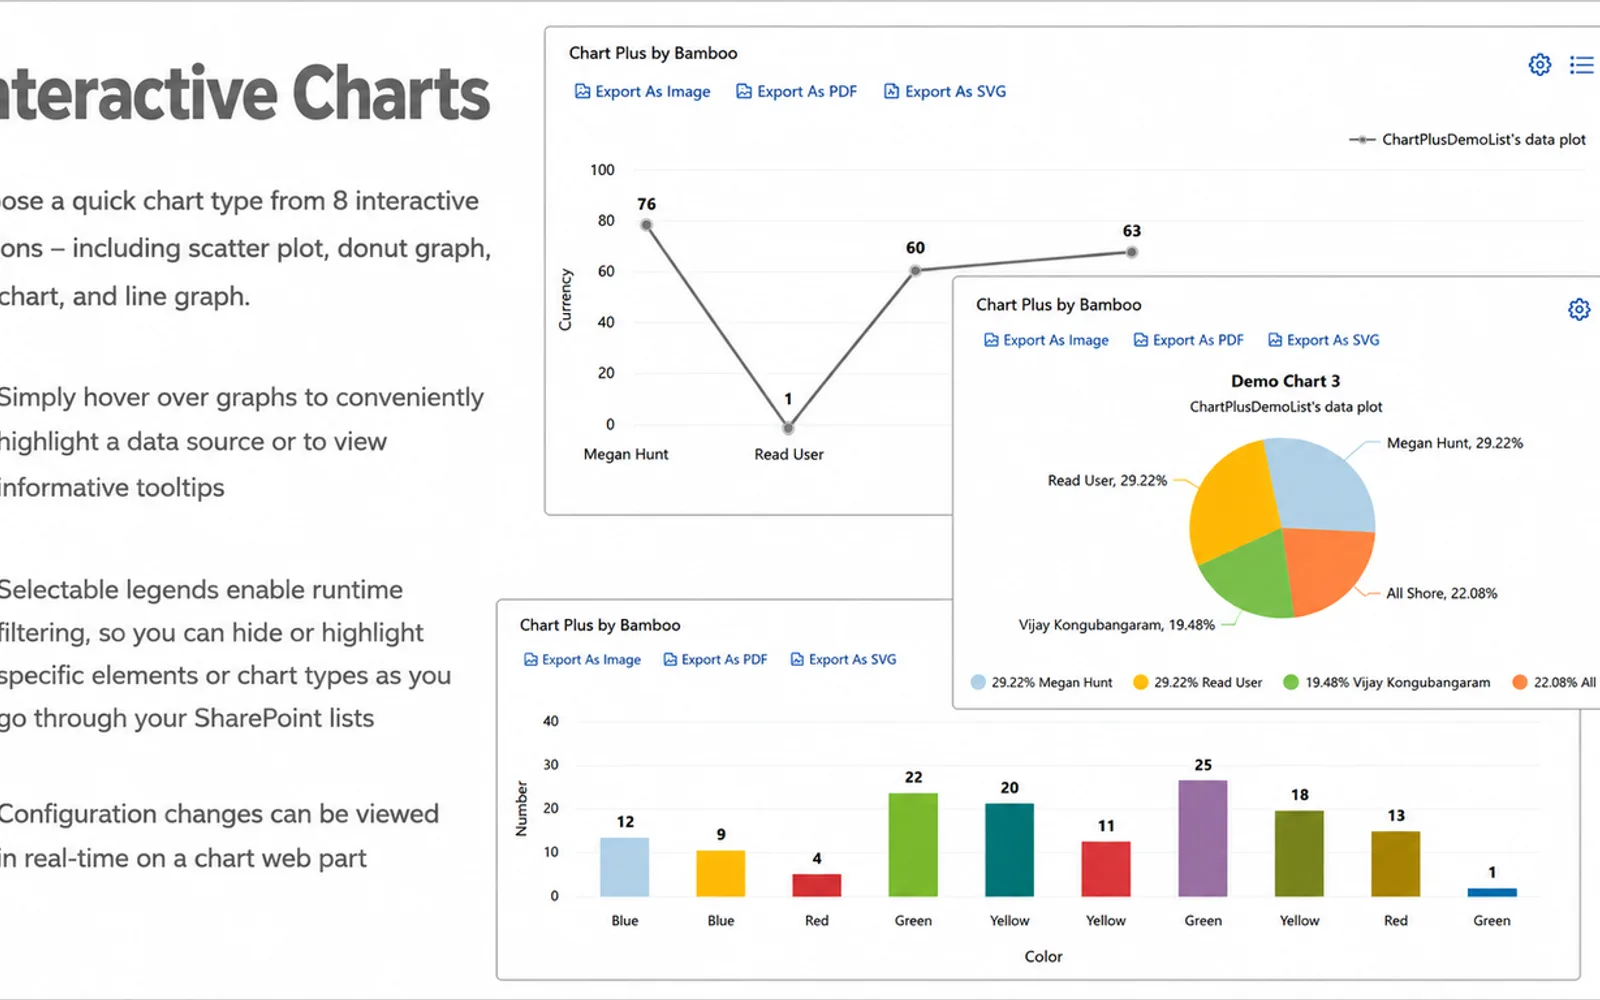
Chart Plus creates interactive charts and dashboards from SharePoint lists or libraries. It offers eight chart types, runtime filtering through selectable legends, hover tooltips, and real-time configuration changes. Data can be aggregated with options including Sum, Average, and Count. Charts can be embedded in SharePoint sites or exported as PDF or PNG files.
Provides eight chart types, including scatter, donut, pie, and line charts.
Selectable legends allow specific chart elements to be hidden or highlighted.
Uses SharePoint lists or libraries in the site collection as chart data sources.
Aggregates data with Sum, Average, Count, and additional options.
Allows charts to be embedded in SharePoint team and project sites.
Exports charts as PDF or PNG files with export controls and formatting options.
Integrates with Bamboo Tenant Manager to monitor product usage and adoption.
Supports SharePoint Modern and Classic sites, SharePoint Online, and Gov Cloud installations.
Administrators and colleagues working with SharePoint team and project sites.
Chart Plus and Business Charts both use cloud deployment and have an unknown pricing model; Chart Plus was updated in Jul 2026, while Business Charts was updated in Mar 2026. Workday integration by adenin also uses cloud deployment with unknown pricing and was updated in Mar 2025. Lucen Track, TeamOrgChart+, and Infowise Ultimate Forms likewise use cloud deployment with unknown pricing and were updated in May 2026, Dec 2025, and Apr 2025 respectively.
| Name | Pricing | Deployment | Updated |
|---|---|---|---|
| this plugin | Price not published | Cloud | |
| Business Charts | Not in catalog | ||
| Workday integration by adenin | Price not published | Cloud | |
| Lucen Track | Price not published | Cloud | |
| TeamOrgChart+ | Price not published | Cloud | |
| Infowise Ultimate Forms | Price not published | Cloud | |
503 plugins in Microsoft 365 · Analytics
Price distribution: 13 free, 51 freemium, 141 paid, 298 price not published
Displays Workday data in SharePoint through a customizable Web part and in Viva Connections via an Adaptive Card extension.
adenin TECHNOLOGIES Inc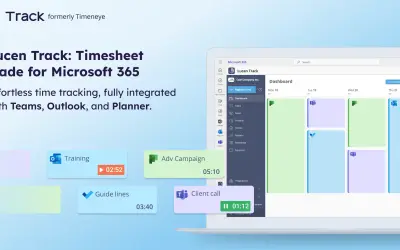
Tracks billable hours, costs, and expenses and produces reports for Microsoft Teams, Microsoft 365, and Outlook Calendar.
DM Digital Software SRL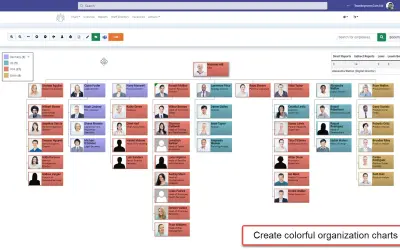
Creates organization charts from Active Directory, SQL databases, SharePoint, and Excel for Microsoft Teams, Outlook, and Office.
TeamImprover.Com Ltd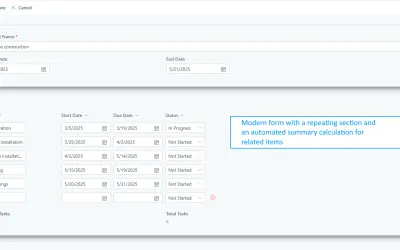
A SharePoint platform for building dynamic forms, automating business processes, and creating reports and dashboards.
Infowise Solutions Ltd«Visually communicate critical data quickly and effectively to assist in making more informed business decisions. Create and share SharePoint charts and dashboards in minutes, using real-time data and interactive elements. Interactive Charts Choose from 8 interactive chart types – including scatter, donut, pie, and …»