
Salesforce to Filogix Expert Two Way Integration
Connects Salesforce Platform with Filogix Expert for two-way mortgage application exchange, validation, and document sharing.
WebSoloFree
Charts account sales trends, yearly targets, recent account updates, and sales breakdowns in Salesforce Platform.
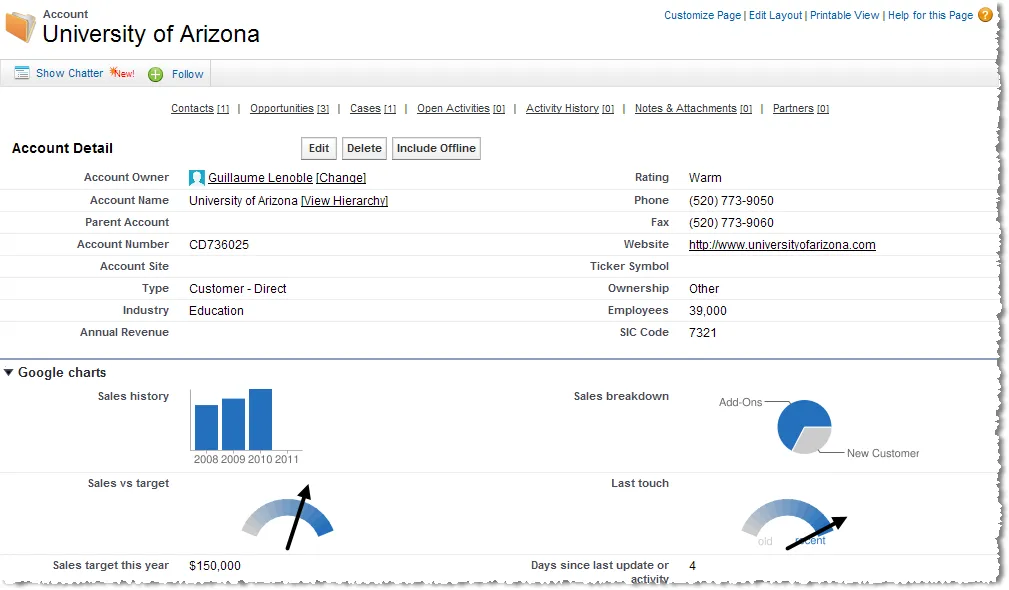
The add-in uses Google Chart technology to show sales evolution for a specific account and compare current sales with a yearly target. It also presents recent account updates and sales breakdowns.
Shows how sales have changed for a specific account.
Compares current sales with the yearly target.
Shows whether an account has been updated recently.
Displays a breakdown of sales.
1,106 plugins in Salesforce Platform · Analytics
Price distribution: 265 free, 166 freemium, 675 paid
Connects Salesforce Platform with Filogix Expert for two-way mortgage application exchange, validation, and document sharing.
WebSolo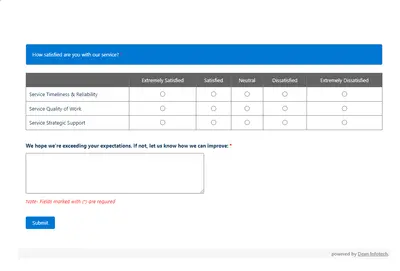
Automates customer satisfaction surveys and stores responses in Salesforce.
Dean Infotech Pvt Ltd
Send, sign, track, and store agreements from Salesforce records with DocuSign eSignature.
Docusign, Inc
Manage contracts in Salesforce with templates, negotiation tools, approvals, workflows, repository search, and analytics.
Docusign, Inc«What is the evolution of your sales in a specific account? Compare the current sales with the yearly target! Has your account been updated recently? What is the sales breakdown? Find these answers and become familiar with the Google Chart Technology! What is the evolution of your sales in a specific account? What is …»